Machine breakdowns or even system downtime are still a worst-case scenario in manufacturing. It stands to reason that machine maintenance is one of the key factors in making production more efficient and reducing costs.
Increase system availability through central system monitoring
The advantages of central system monitoring at a glance:

Unplanned downtimes are one of the main cost drivers, as they are often detected too late. In addition, fault descriptions are almost always missing. This means that additional time and capacity must be spent searching for the cause of the problem – because until this is known, neither the right measures can be determined nor the right contact person for central maintenance contacted.
Faster detection and rectification of unplanned plant downtimes can increase daily production by an average of ten percent.
However, central plant monitoring offers real added value not only in the event of a plant shutdown: process deviations are detected more quickly, for example in the event of creeping deterioration due to longer cycle times or slowly increasing energy consumption.

Competitive advantage thanks to central system monitoring

A system standstill inevitably leads to production backlogs and a reduction in the number of units. This can only be counteracted with overtime or the provision of reserve capacity. The costs sometimes add up to dizzying heights.
Therefore, keep the number of plant downtimes as low as possible by increasing plant availability.
Companies that implement the following four parameters are better prepared and thus create a real competitive advantage:

1. real-time machine data acquisition (MDE)
The availability and exchange of data in real time creates transparency and is a real added value for many processes. In order to be able to react to ad hoc scenarios, the key to success lies in real-time data acquisition: this means that a failure is communicated directly and the cause is displayed. This significantly increases the ability to act as well as the speed of reaction and implementation.
2. fast communication flow
In the event of an unplanned plant shutdown, various groups of people and sub-processes are affected. Continuous and, above all, rapid communication to all those involved is essential in order to limit the damage and maintain the highest possible production efficiency despite the outage. For example, communication can take place via notifications on the smartwatches of the responsible maintenance personnel. This creates a flow of information in near real time, regardless of where the employees are at the time of the incident.
3. system monitoring through intelligent analytics and comprehensible reports
Learning from problems is the best approach to optimization. With the help of intelligent data analysis and reporting, potential for improvement can be identified and recurring problems can be eliminated in the long term. This allows us to act and react even better in the future – in the spirit of a continuous improvement process (CIP).
4. real-time visualization in the cross-system "Control Tower"
Centralized system monitoring in the control station provides an overview of the entire production process. With horizontal data integration, it is not just a specific system or a limited area that can be viewed. Real-time visualization and monitoring of the entire, partially interlinked process makes it possible to analyze process correlations and the effects of individual production problems.
High plant availability & optimum production efficiency
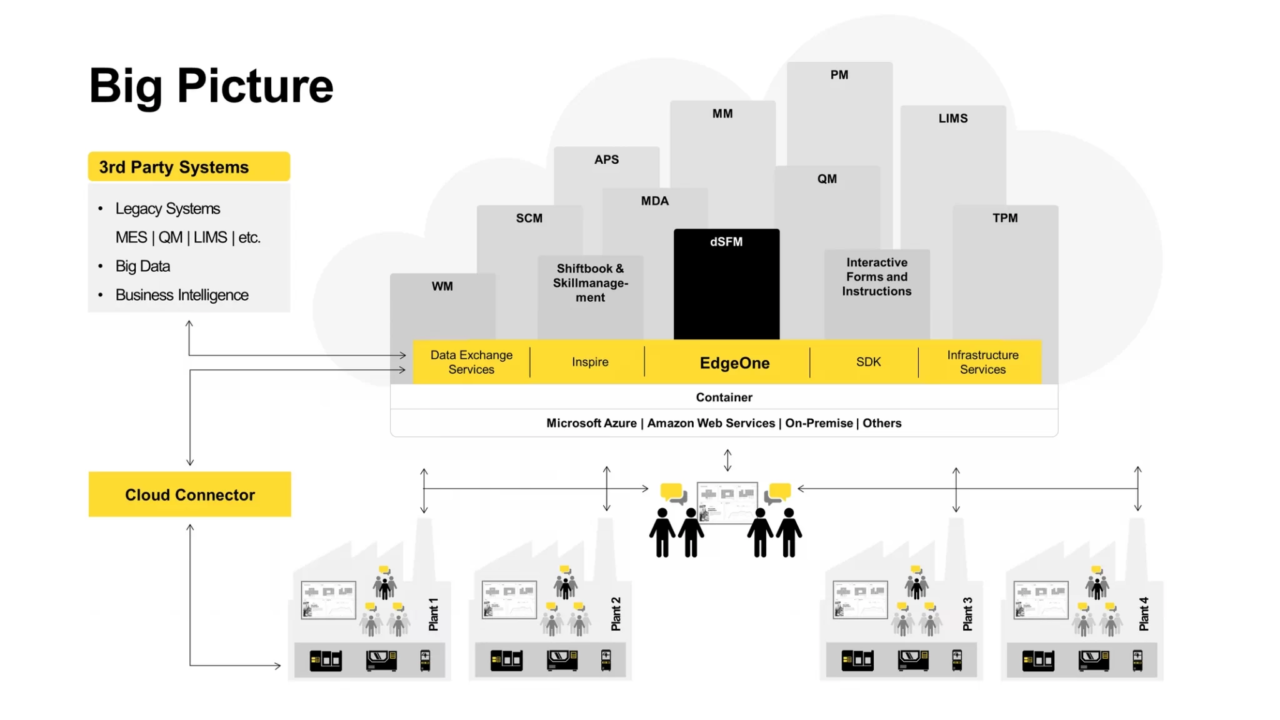
The module for central plant monitoring in our MES software solution Legato Sapient enables a machine connection for real-time data acquisition – for both homogeneous and heterogeneous machine parks across different communication variants.
Regardless of the manufacturer of the production machines, over 2,000 machines can be connected in a single system.
Machine connection: simple & flexible
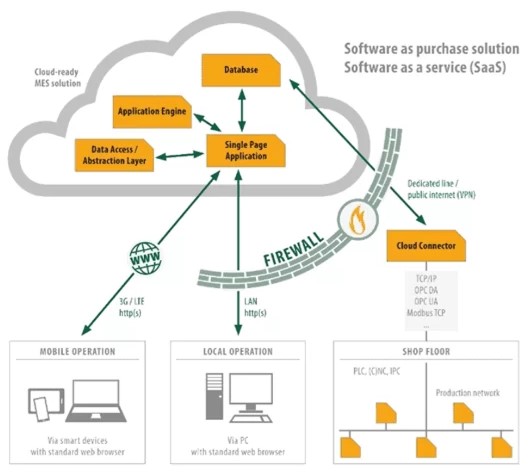
Based on this machine connection, process values and fault messages can be recorded and visualized in real time. The user front end is called up via a standard web browser and can be displayed regardless of whether the information is required in the control station, via large displays, on mobile devices or on a PC.
The status of the plant, the production line or a machine can be queried at any time and from anywhere in real time.
Clear visualization in production
The graphical visualization makes it easier to identify problems, for example by schematically colouring production areas or individual systems depending on the status quo. In the event of a system downtime, machine maintenance is automatically notified – via a call system or information on the smartwatch. Automatic escalation ensures that an employee takes care of targeted maintenance.
Target/actual comparison for optimal monitoring
Thanks to the recording of process values such as quantities, cycle times or energy values in combination with continuous monitoring by means of defined target and limit values, the software solution enables optimized production efficiency beyond the event of a malfunction. Just as in the event of a standstill, the system provides information about irregularities and deviations and thus offers not only monitoring, but also the basis for optimized decision-making. This allows you to get the best out of your production.
High system availability and optimum production efficiency
The IT/OT connector is the heart of real-time machine data acquisition from the plant control systems (PLCs). Both OEE data acquisition and production control are carried out via this component. Once the data has been recorded via the IT/OT connector, it is processed further or displayed in the web visualization.
In the case of central system monitoring, there are generally two use cases:
- Recognizing and stopping gradual process deterioration (e.g. when cycle times slowly deteriorate)
- Detecting and rectifying system downtimes
Graphic visualizations are often used to detect system downtimes, whether as a large display in production (ANDON), in the control station or in a maintenance office.
Real-time visualization for “error-driven drilldowns”
Depending on the application, different levels/depths of detail are used. Within a plant, we typically distinguish between four levels:
Level 1: Layout for production and plant managers
The so-called plant overview shows the top level with color coding of the individual areas. The color code represents the target/actual comparison of quantities and thus provides an optimal overview of the performance within the production areas. This layout is therefore very helpful for production or plant managers.
Level 2: Representation for production or maintenance managers
This is the display level for a production or maintenance manager of a plant or segment. In this case, the corresponding segment is displayed divided into areas, with the rectangular boxes each representing the “issuing” plant of an area. The round shapes visualize the various MES buffers including fill level and limit values. This view already contains a number of relevant “vital values” for the individual areas, such as the type of malfunction or number of units achieved (target/actual comparison).
Level 3: Display for line managers or foremen
This display level is aimed at a line manager or foreman. In this case, the corresponding production area is displayed subdivided by plant, with the rectangular boxes representing the plants and the round shapes again visualizing the MES buffers. The display of the information is consistent with the higher-level view.
Level 4: Display for plant operators
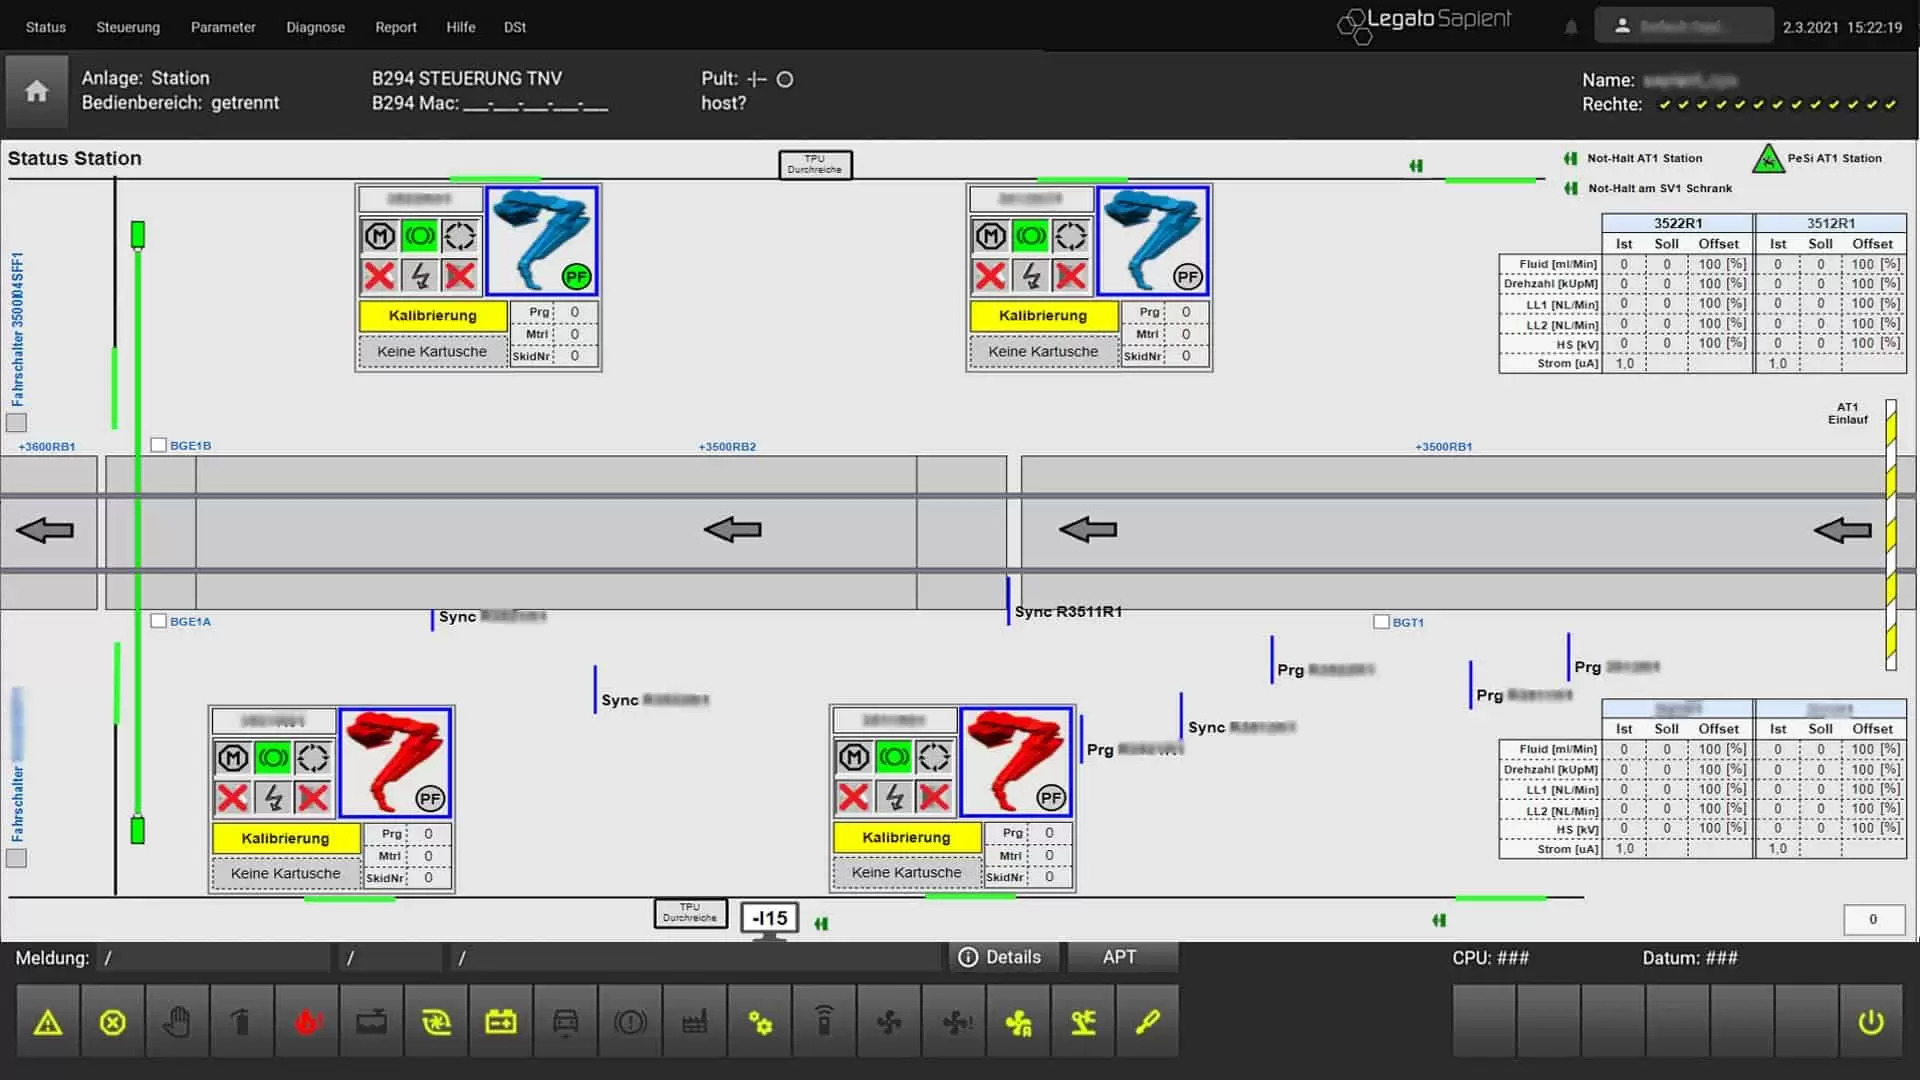
The most detailed display is designed for a plant operator. In this case, the corresponding system and its robots are displayed. In addition to the display of the robots, other relevant status information from safety doors or light barriers is visualized.
Evaluating process deviations with visualization in production
If the plant has not yet come to a standstill, there is still a risk that the process is slowly “getting out of hand”. The Legato Sapient MES software helps you to detect process deviations at an early stage.
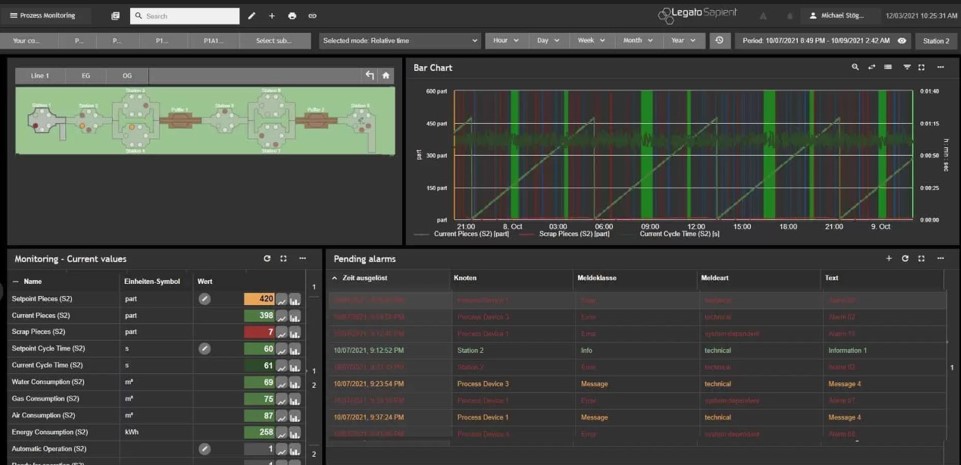
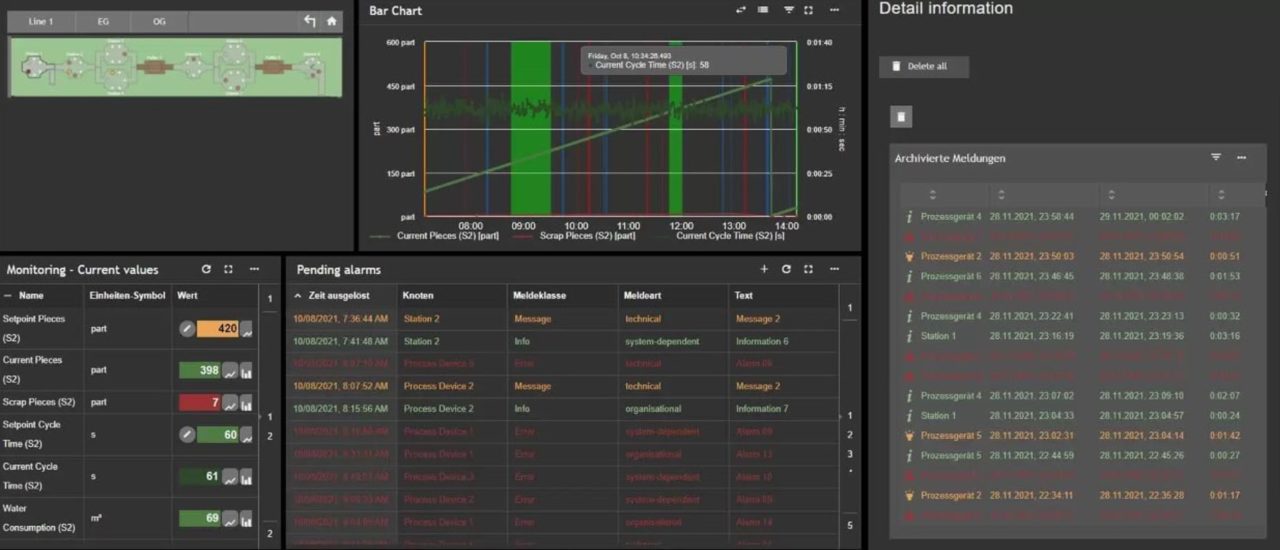
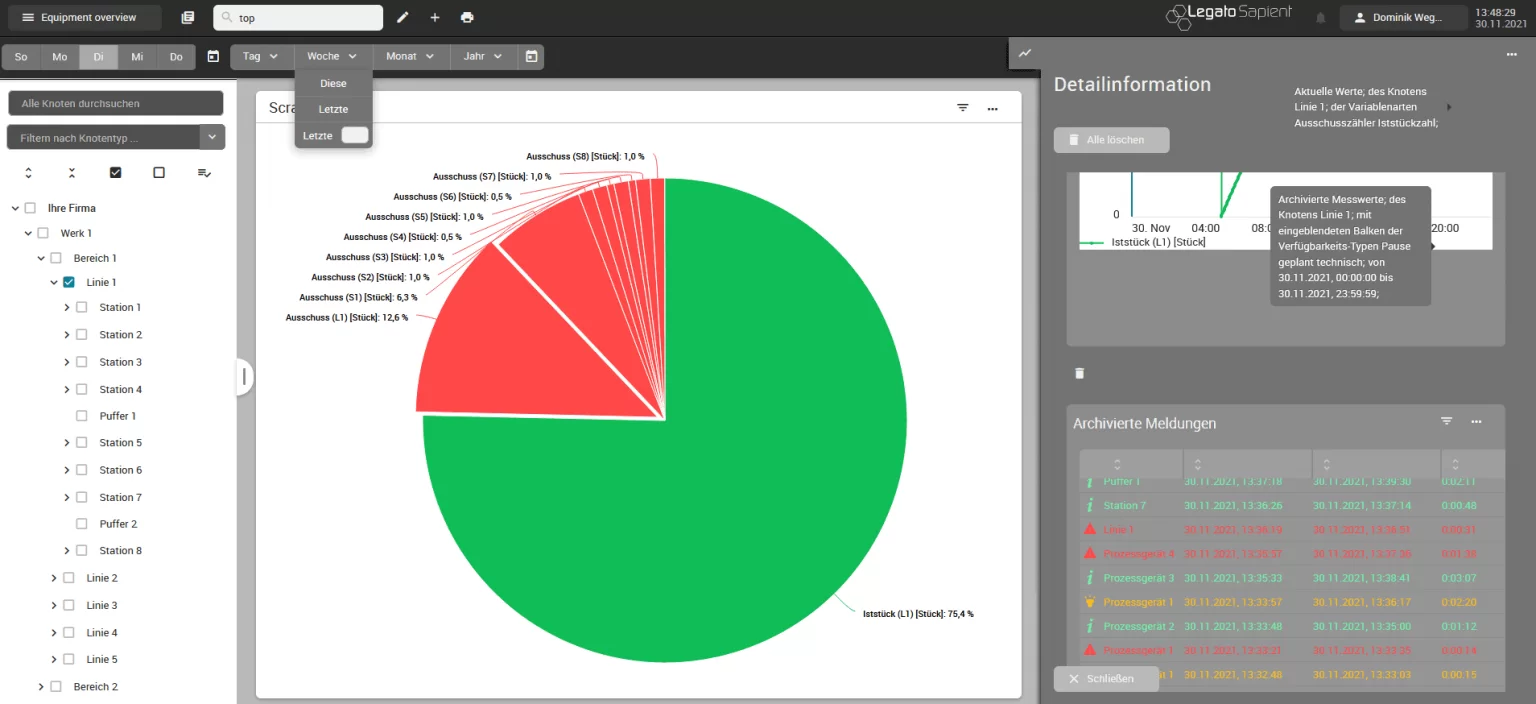
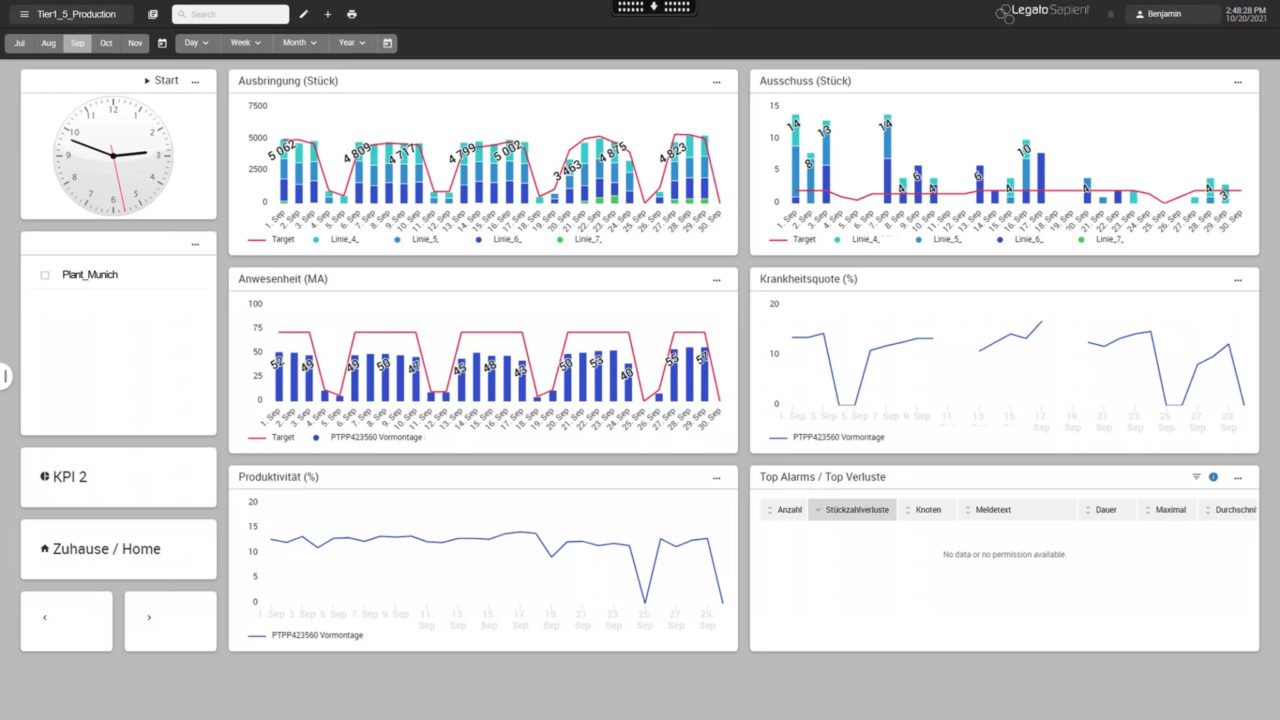
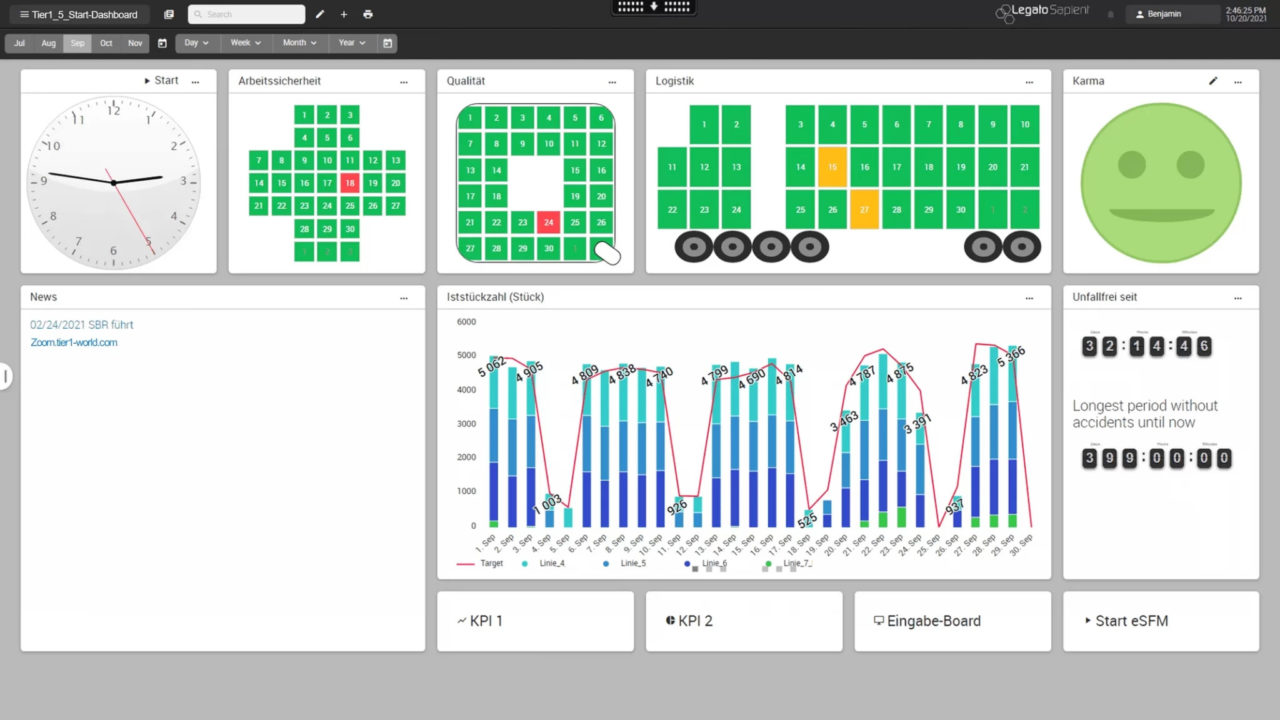
You can use the dashboard below to identify and correct process deviations in good time. In the top right-hand section, deviations can be detected on the basis of the piece count history if the current actual piece count is below the current target piece count.
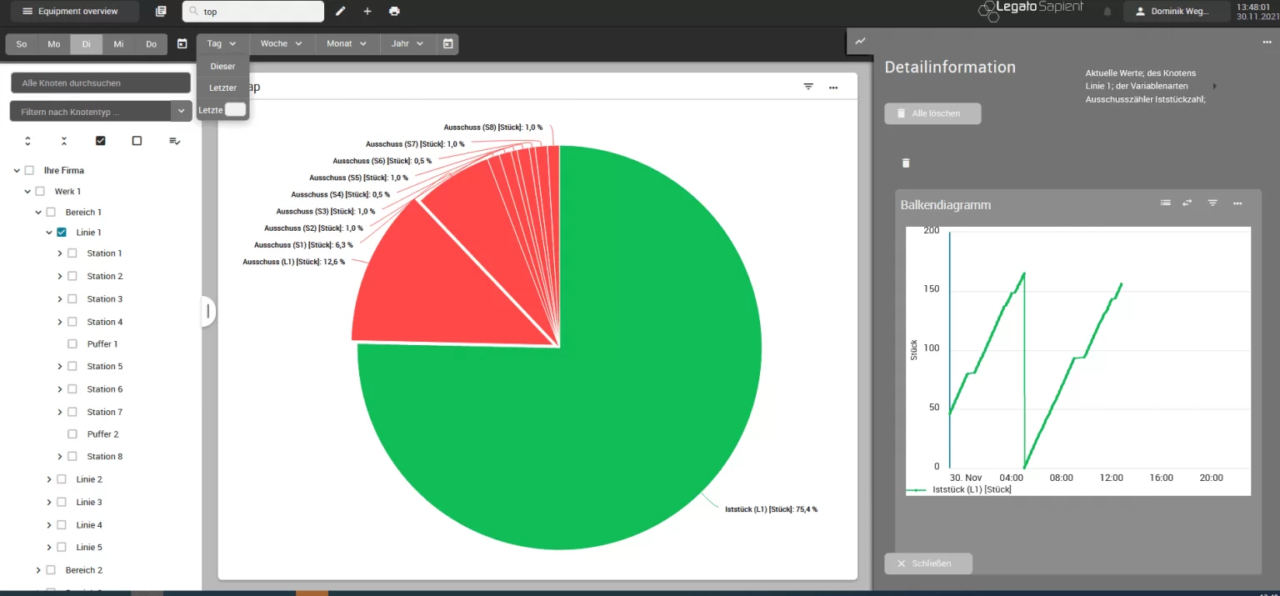
For more detailed analyses in relation to the quantities, zoom into the diagram at the time of the deviation and click to open the sidebar with further analyses. The associated disruptions for the selected period (zoom area in the diagram) are shown below:
The user frontend contains numerous options for interacting with the data presented. This ensures maximum flexibility for detailed analyses and ultimately high plant availability and overall equipment effectiveness (OEE).
FAQ: Important questions about system availability
What does system availability mean?
The term system availability refers to a target/actual comparison. It indicates what percentage of the time a system has actually produced compared to the planned production time. Machine availability is the analogous term for machines.
What constitutes good system availability?
Plant availability is often expressed by the OEE indicator. If the available capacities are not being used optimally – which is indicated by a value of less than 65% – the production process and efficiency should be optimized: Downtimes and error states of the production equipment should be analyzed urgently and thoroughly. If the value is above 65%, plant availability is good. However, there is long-term optimization potential for almost every system.
What does OEE stand for and how is this key figure determined?
OEE is the abbreviation for Overall Equipment Effectiveness. In German, the abbreviation GAE is also used for overall equipment effectiveness. The OEE value is made up of the product of three factors:
- Plant availability,
- performance (degree of utilization) and
- quality
It theoretically ranges between 0% and 100%.
Why is it important to increase system availability?
Companies can use the OEE key figures to identify optimization potential for plant availability and make decisions based on solid indicators.
The aim of increasing plant availability is to avoid unplanned downtime, rejects and rework. This enables you to identify inefficient production areas and their causes and use this transparency to derive effective measures to systematically increase productivity.
Machine data acquisition to increase production output
Advantages at a glance
Maintenance costs often explode because the actual causes of machine downtime are not rectified. Subsequently, downtime losses due to overtime or additional reserve capacity have to be made up. Legato Sapient analyzes every process step in real time so that you can tackle the actual causes of downtime in the long term. Machine data acquisition allows you to systematically analyze OEE and aggregate the values into meaningful key figures, such as OEE (Overall Equipment Effectiveness), MTTR (mean time to repair) or MTBF (mean time between failures).
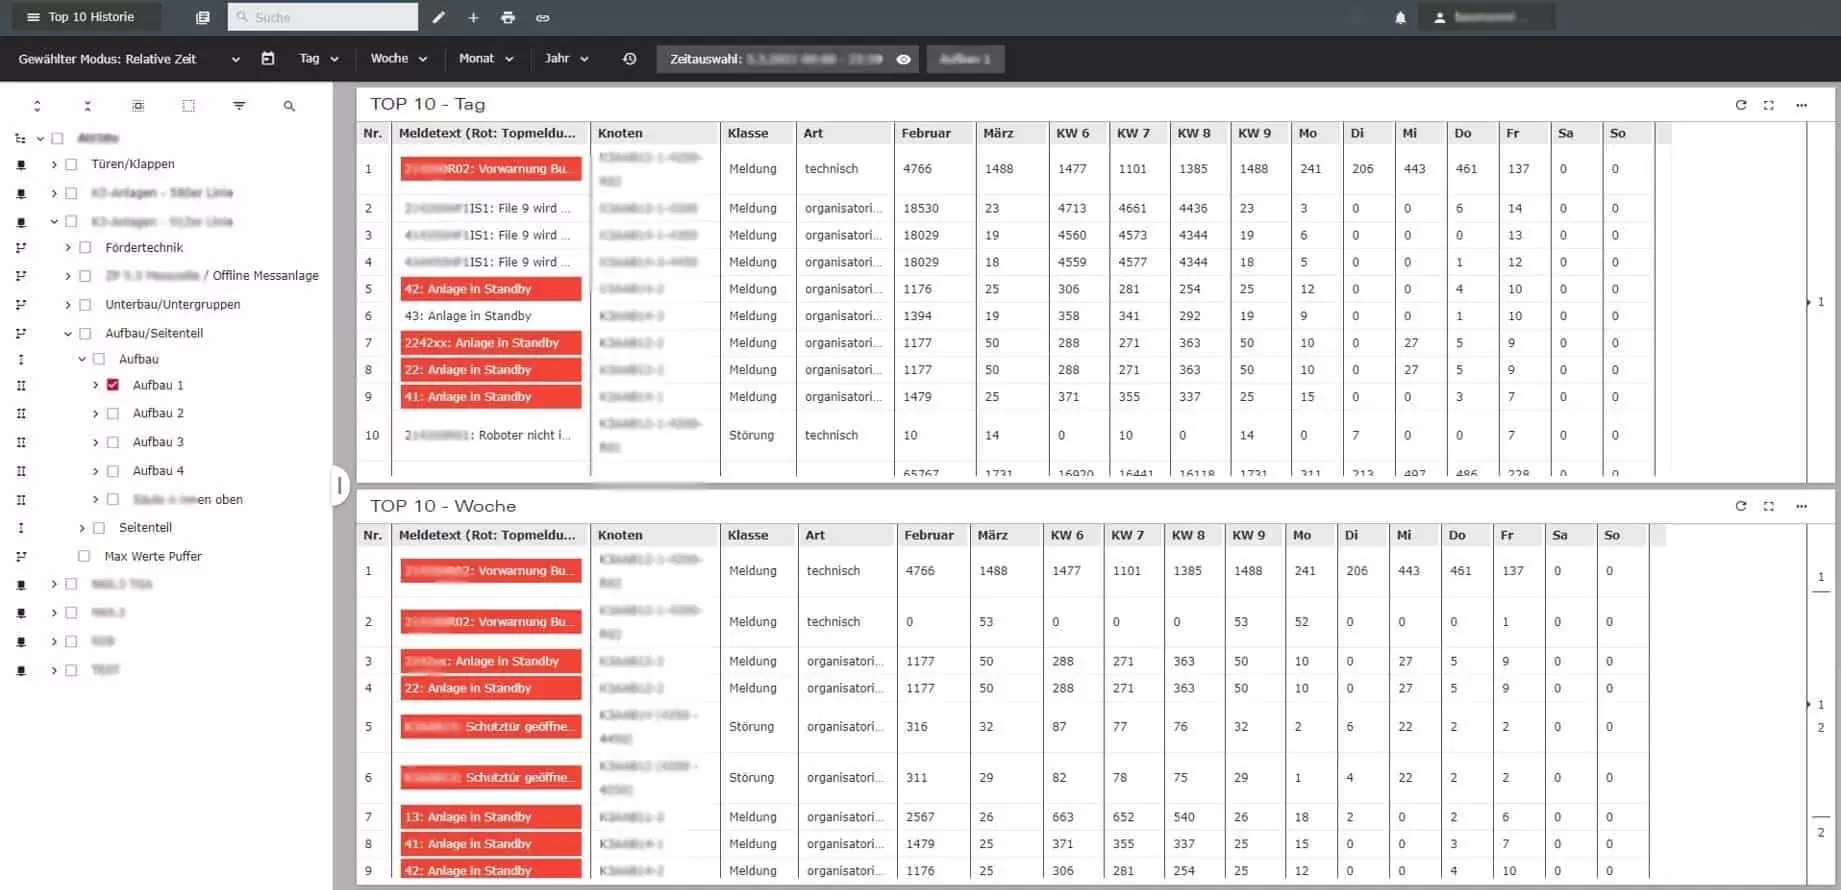
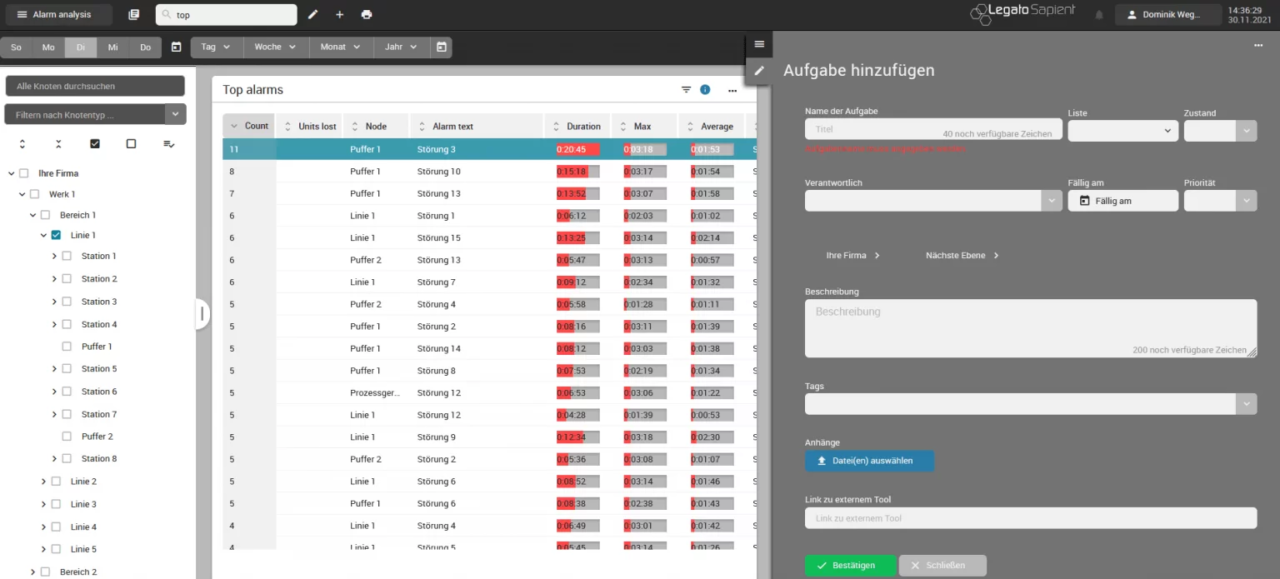
TopX evaluations of machine downtimes and their causes reveal potential for improvement, which can be successively processed. The causes of problems can be tracked and eliminated directly via the integrated action control system – in line with the continuous improvement process (CIP). This means that your day-to-day business will in future be determined by preventative action and no longer just by problem-driven reaction.
Machine data acquisition that creates business value

Production KPIs create transparency. The module of our MES software solution Legato Sapient enables automatic calculation and aggregation of information. The insights generated in this way allow you to identify and resolve process deviations more quickly. Simplify your action management with an OEE analysis.
By using our software solution, you can achieve an increase in production of at least 3% – a result that can generate additional millions! The increase in overall equipment effectiveness is based, for example, on the reduction of response times in the event of a malfunction. In this way, you increase plant availability.
Real-time monitoring of buffer levels and system interlinking also enables you to avoid idle times and further increase output. An optimized cycle time saves further valuable minutes that contribute to increased production.

Legato Sapient: Your system for long-term improvement of output and overall equipment effectiveness
As an information basis for OEE data acquisition, we connect both homogeneous and heterogeneous machine parks via various communication variants. It is irrelevant which manufacturer your production machines come from – over 2,000 machines can be docked to one system!
The recorded data is then aggregated into meaningful key figures, such as output, quality rate, machine availability, MTTR, MTBF and many more. Target and limit values can be defined for each KPI, so that the actual status can be constantly monitored against the target value. All information can be accessed via a standard web browser. For the best possible understanding, both tabular and graphical evaluations are available for displaying the key figures.
Our software solution enables you to evaluate downtimes. By successfully eliminating the causes of faults, you can avoid recurring faults in the long term.
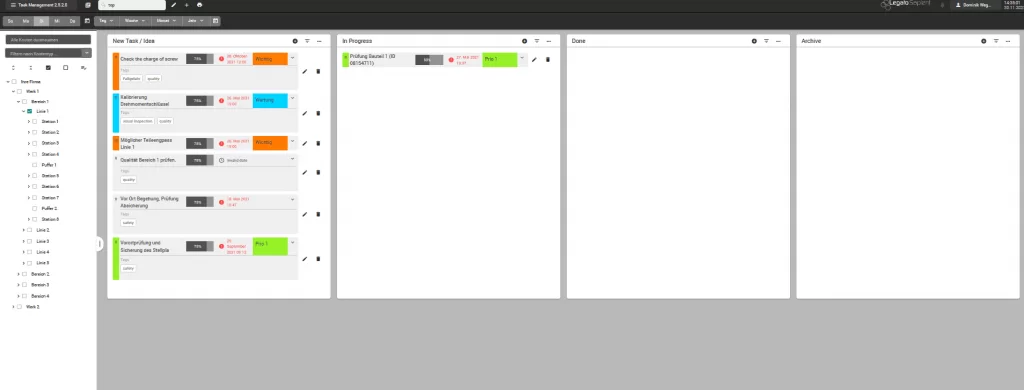
Our software also offers dedicated action and measure management. Work systematically and continuously on various tasks, such as the sustainable avoidance of recurring faults described above. To do this, you can create measures for various events directly in the system, which can then be tracked with due dates and responsibilities in line with the CIP. This considerably simplifies communication and collaboration within the team, as everyone has an overview of the measures and various subtasks can be assigned to the relevant experts. Use the information for store floor management and the morning meeting so that the depth of information is also increased here.
Click demo in the OEE analysis
According to the motto “many roads lead to Rome”, Legato Sapient has various starting points for improving overall equipment effectiveness in the long term.
Visualization of actual and target quantities
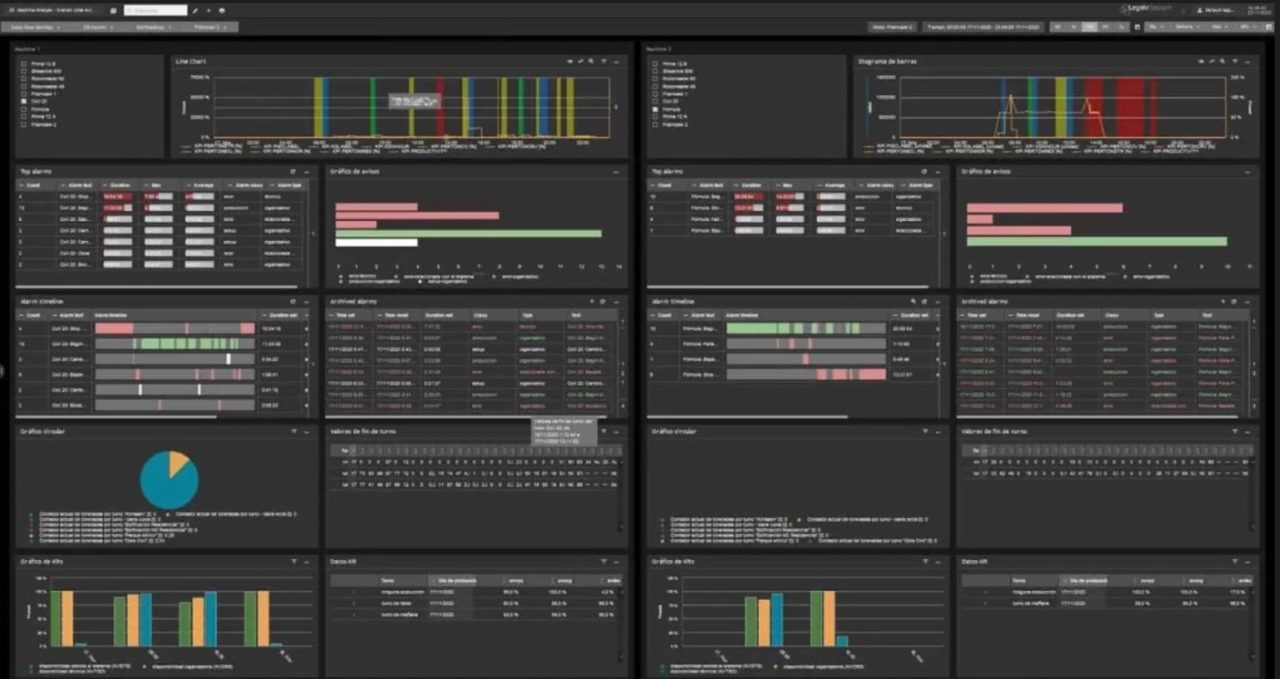
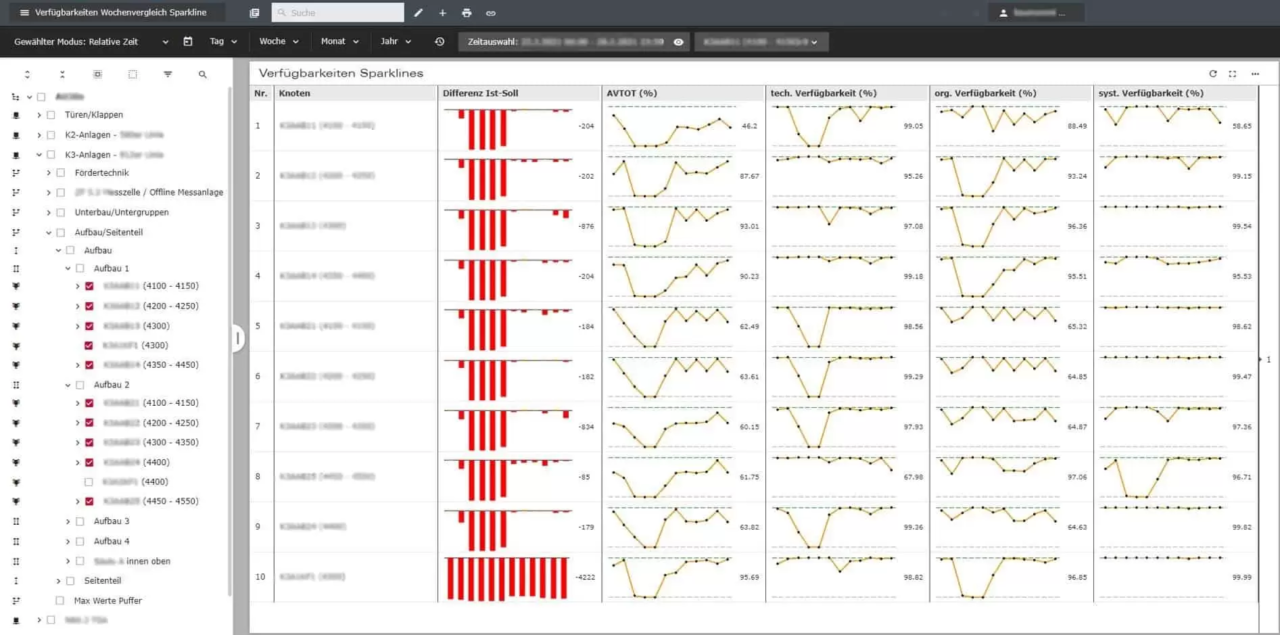
It is often started by looking at meaningful KPIs such as the production efficiency of an area or the plant availability. In the following screenshot, several areas or systems can be compared with each other via “Multiselect”. In this case, the output (actual vs. target quantity) and availabilities (total, technical, organizational and system-related) are compared.
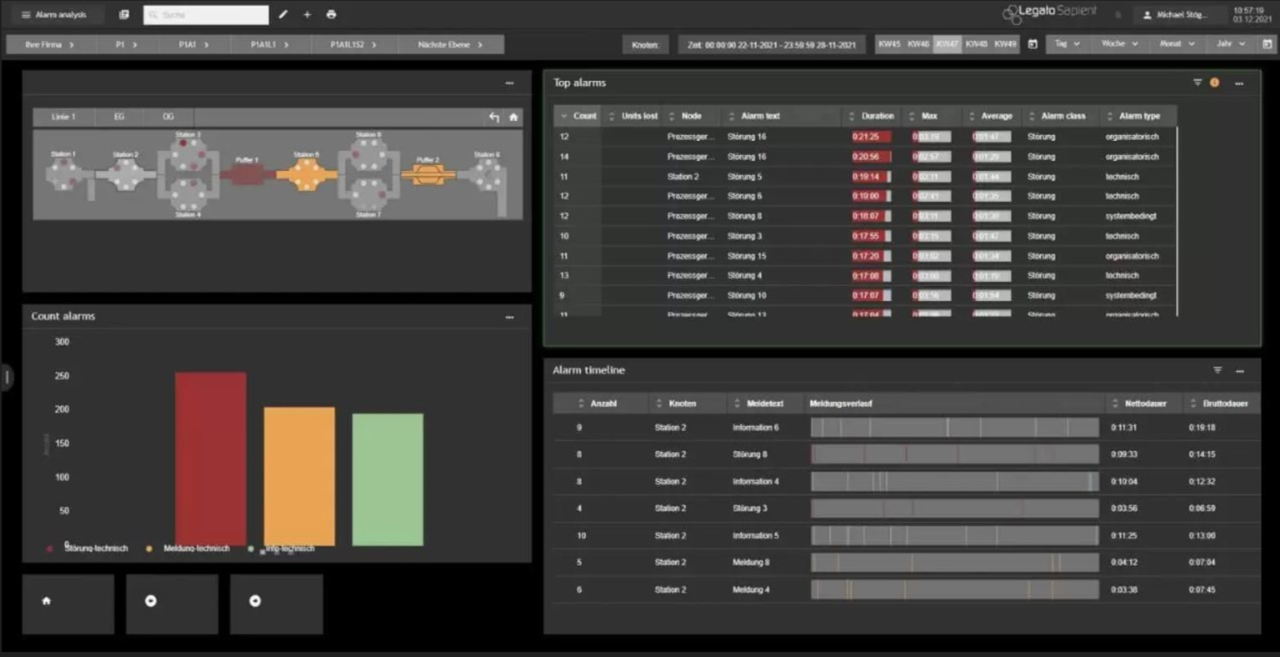
This comparison allows the “weakest” systems or areas, i.e. the “bottle necks”, to be identified. Based on this, a more in-depth analysis of the causes is then carried out. The typical fault evaluations, such as TopX faults, are used here. Determine the main causes and take preventive measures in the CIP.
Visualization of limit and target values
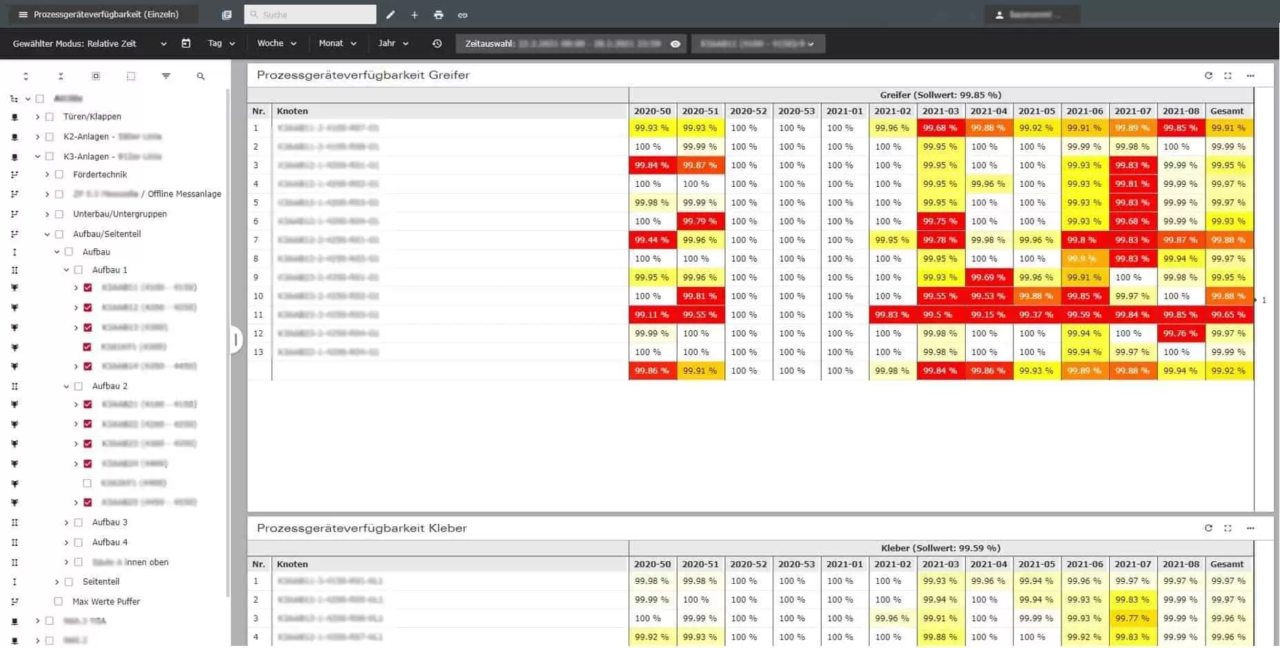
An alternative view is shown in the following screenshot – here, availability values below a defined limit/target value are automatically colored, allowing you to identify the critical fields of action even more quickly.
This view also serves as the basis for a more in-depth evaluation of the causes, typically using fault evaluations such as TopX evaluations.
Further key figures for production data analysis
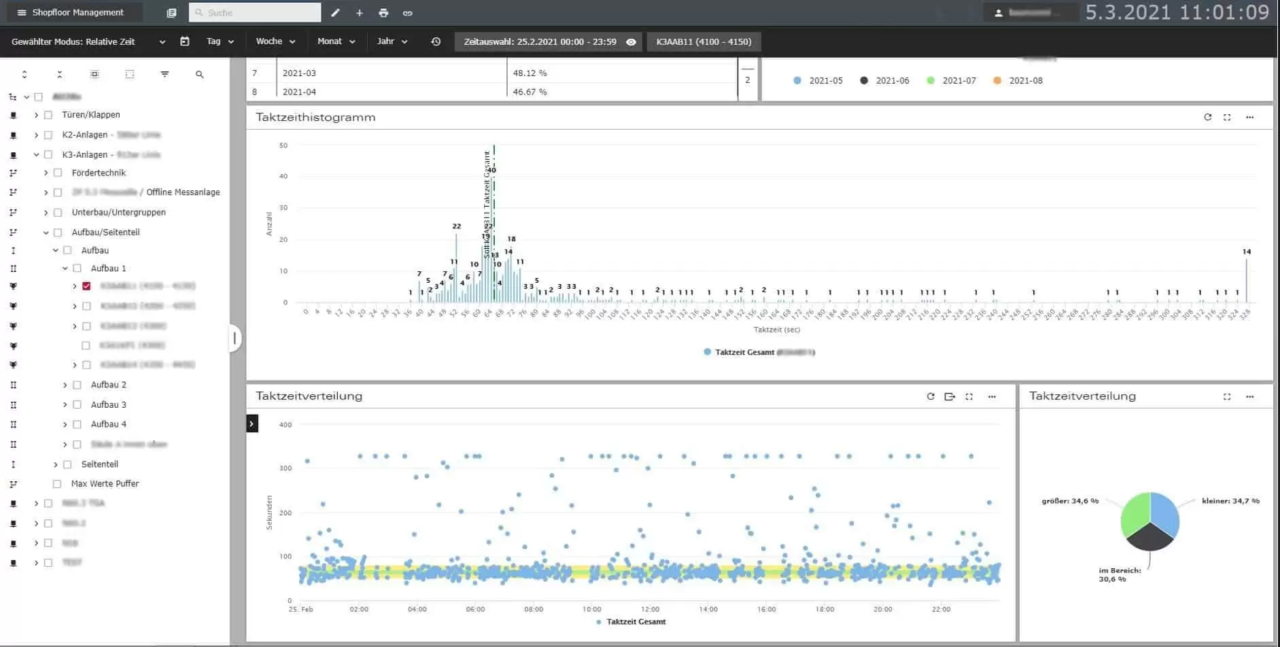
In addition to availability and quantities, other key figures are used to increase overall system effectiveness. The following example shows a typical illustration that helps to detect faults in the process. In the lower area, each point represents a cycle time – all points that are not in the green-yellow band are cycle time overruns above the limit values. In each case, there are faults in the process.
As part of the further production data analysis, the diagram is “zoomed” into the affected time range. The 3 dots at the top right of the boardlet can then be used to take a closer look at the respective fault messages for the affected time range.
FAQ: Important questions about OEE analysis
What is meant by OEE?
Overall Equipment Effectiveness (OEE) is the key performance indicator used by manufacturing companies to measure output. It is a summary of the subordinate key figures availability, performance and quality. Ideally, the target rates would be achieved in the available time without rejects. The OEE value would then be 100%. In reality, OEE values between 65% and 85% are considered good.
What are the benefits of using machine data acquisition software for your company?
Comprehensive machine data acquisition allows you to optimize output at various levels. On the one hand, the real-time data allows you to shorten response times when downtimes or malfunctions occur. Secondly, you can identify top faults in the historical data history and eliminate the causes. Last but not least, digital machine data acquisition simplifies communication and task distribution within the team.OEE is the abbreviation for Overall Equipment Effectiveness. In German, the abbreviation GAE is also used for overall equipment effectiveness. The OEE value is made up of the product of three factors:
- Plant availability,
- performance (degree of utilization) and
- quality
It theoretically ranges between 0% and 100%.
What role does the OEE analysis play in the CIP?
Analyzing the OEE in your company allows you to introduce continuous change processes (CIPs) and thus sustainably increase overall equipment effectiveness. By using the data history to detect failures at an early stage and plan preventive maintenance measures, you can optimize your output and work together proactively instead of just reacting to faults.
Get in touch!
Would you like to know more about our solutions? Then please write us using the contact form. My colleagues and I look forward to exchanging ideas with you.

Dominik Weggler
Head of Sales Germanedge
Avoid rework in production by tracing components
A recall is the worst case scenario for any company. It causes enormous costs and makes negative headlines. Product recalls are not uncommon. According to statistics, there are around 300 product recalls in Germany alone and over 2,000 Rapex notifications from European member states every year. Reworking in production results in costs that can quickly run into the tens of millions. Reducing these scenarios by just 1% means enormous cost savings.
Ideally, you will recognize quality problems in production at an early stage and take immediate action. If a recall or rework is still necessary, it must be carried out quickly and in a targeted manner. Automated track and trace solutions are necessary to enable the traceability of components in production.
Advantages of traceability MES software
Traceability in production
Tracking & tracing for component traceability is a core function of the Legato Sapient MES solution. It enables seamless tracking and tracing of all products, including all product-relevant data – throughout the entire production process. This creates a complete image of each production unit – a digital twin. This includes all product data (e.g. order, type, features, quality status), product-related process data (e.g. torques, temperatures) and product-related system data (e.g. status, faults).
360° panoramic view for Track & Trace
As a key player, the MES enables the traceability of raw materials, intermediate or end products via corresponding reading points in the process. In addition to this practicable method, there is more to comprehensive Track & Trace.
60% of production companies only use tracking & tracing half-heartedly to reduce rework in production. You can only exploit the full potential in conjunction with machine data acquisition (MDA) and production data acquisition (PDA). This includes automated real-time data acquisition from the production process in order to guarantee high data quality and real monitoring of the actual situation.
Furthermore, tracking & tracing via an MES as a global control station has the advantage that you can view and analyze the seamless component tracking of all product-relevant data across the entire production process (from raw material to end product) at any time – unlike with local RFID data storage, for example. An MES can act as a central data hub for this purpose, providing not only transparency within the entire production area – horizontal data integration – but also real-time information from the store floor for the business level – vertical data integration.
With all the collected and stored data, a large number of aggregated values and key figures can be generated (e.g. processing and transport times, quality level), which serve as the basis for the continuous improvement process (CIP) and thus enable an increase in efficiency in terms of costs, time and quality.
Process interlocking – more than just tracing production
Seamless recording of data in terms of transparency is essential. In addition, modern tracking & tracing in terms of quality control should not only be used for prevention and monitoring. Rather, it should also include functions for quality control in order to be able to initiate appropriate processes when components or batches of poor quality are identified – not only track & trace but also control.
Control can take place automatically, i.e. event-controlled via defined process limit values and monitoring of the actual values from the control systems, or by manual marking by a production specialist. If a production unit (PU) in the production flow is assigned a blocking status, this process value is documented in its life file. Corresponding entries in the block list stop further processing of the affected PU and enable early ejection. This prevents unnecessary and cost-intensive further processing in the production process.
Carrier Management & PU Coordination (Skids)
For some production processes, it is not possible to transport the production unit itself. For this purpose, special means of transportation are used as “workpiece carriers”. Carriers or skids have their own ID (carrier ID), which is used for identification at the reading points. The identification of the production unit in the PU coordination is then carried out indirectly via the carrier ID to which the PU ID was assigned during merging. This is now a standard method for establishing the link between the identified carrier and the production unit.
Without a central system such as the MES, identification at a reading point takes place exclusively for the upcoming production process to carry out the work process, i.e. without tracking the means of transport. An MES can also be used to track the recorded information of the means of transport. This enables real-time tracking in production. Additional information (e.g. route, number) supports PU coordination and provision of the means of transport (in the right place at the right time), which in turn improves organizational availability. Insight into the duration and frequency of use also enables improved maintenance in the sense of predictive maintenance.
Click-Demo: Traceability in production
The example shows the use of Track & Trace for tracing production units. The aim is to obtain information on identified production units for the “final assembly” production area in plant 2, to check the quality status and to change the Q status of a PU.
- Initial situation: Due to problems detected with a tool (screwdriver) in the final assembly of line 1, the affected production units must be identified in the sense of “tracing”.
- Objective: Identification of the affected production unit(s), inspection and, if necessary, change of the quality status in order to block the corresponding products for further operations (ejection, separate quality inspection, rework, scrap or reintroduction)
Step 1: Selecting the Track & Trace Dashboard "Overview"
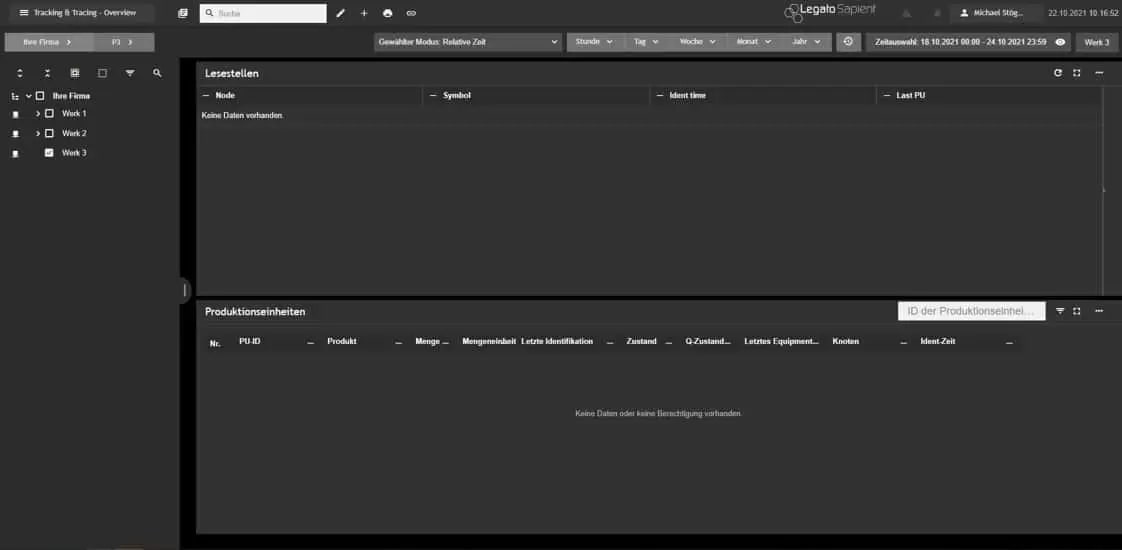
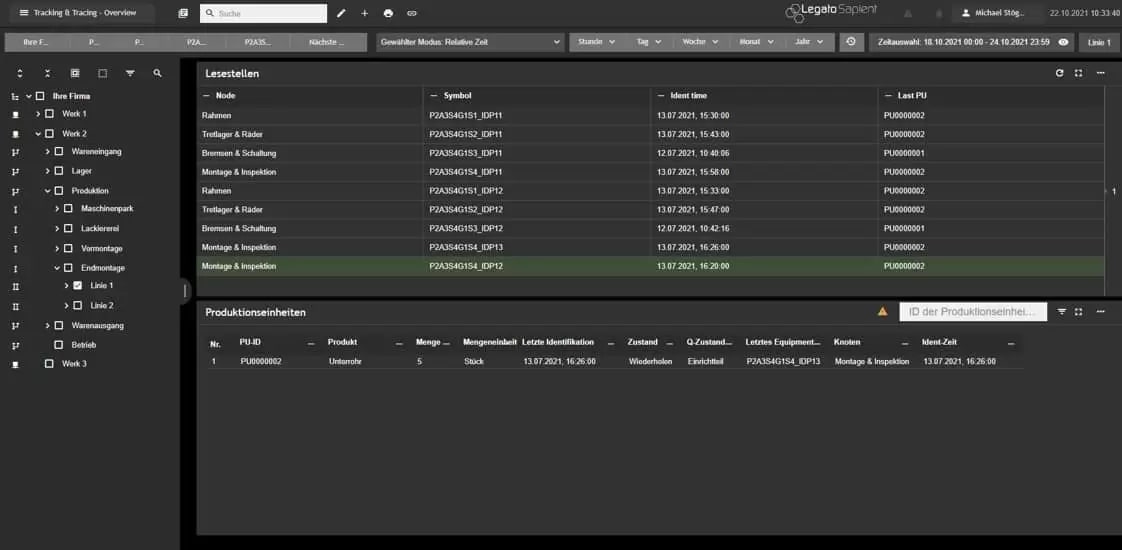
The dashboard provides all information on the Track & Trace reading points (identification points) and the production units identified via them. The navigation tree (logical production structure) is displayed in the left-hand area. There are no reading points for the currently selected node “Plant 3” and therefore no information is displayed in the “Reading points” and “Production units” boardlets.
Step 2: Selection of the relevant production area
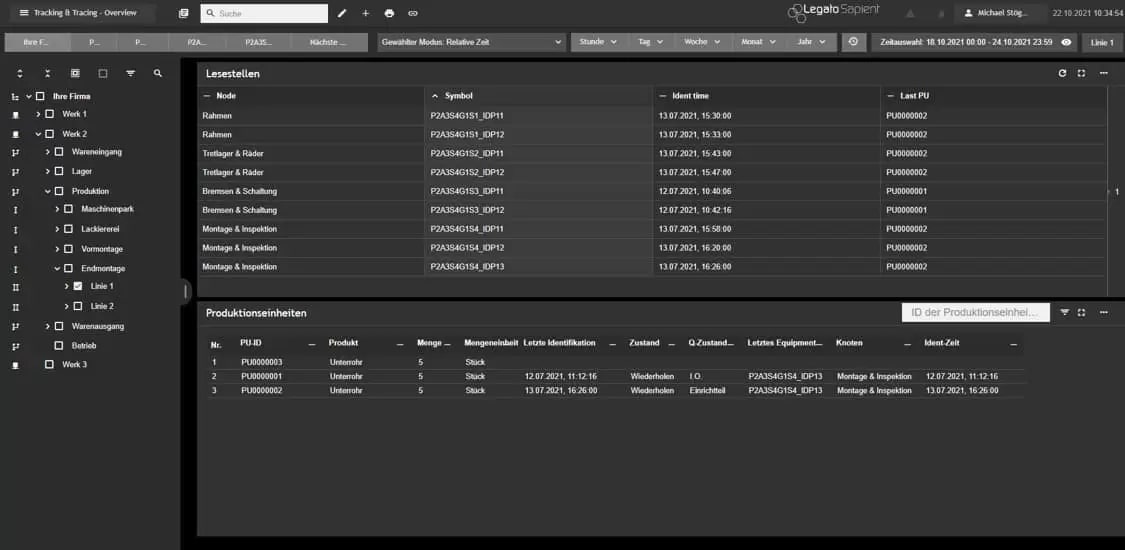
By selecting the relevant production area (final assembly, line 1) in the navigation tree, the contents of all boardlets are updated. In the “Reading points” boardlet, all reading points of line 1 and the PUs last identified above them are displayed, including the time of identification.
The “Production units” boardlet lists all production units that were recorded at the reading points shown above, with details of each PU ID. The time range can be set as an additional filter criterion (e.g. time of occurrence of the assembly problems and therefore possible affected production units).
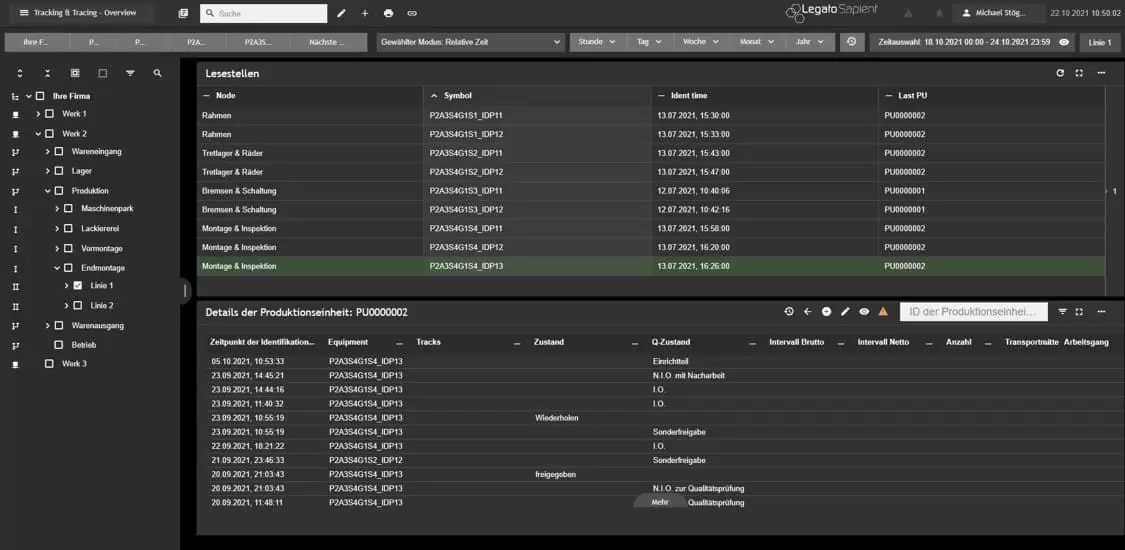
Step 5: Detailed view of the production unit
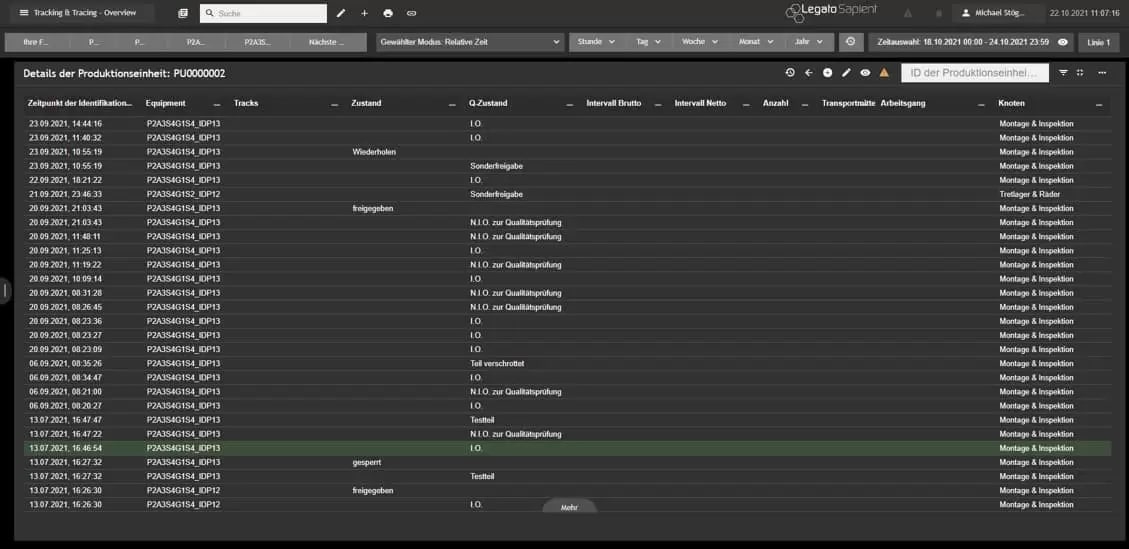
The detailed view shows the complete tracking history of the PU, which was created based on the identification at the individual reading points in combination with automatically recorded process/machine data and operator input. This means that the entire logged process can be viewed and analyzed in terms of tracing. For better analysis, the view of the “Production unit details” boardlet can be maximized and the side navigation tree can be hidden.
Step 6: Analyzing PU coordination
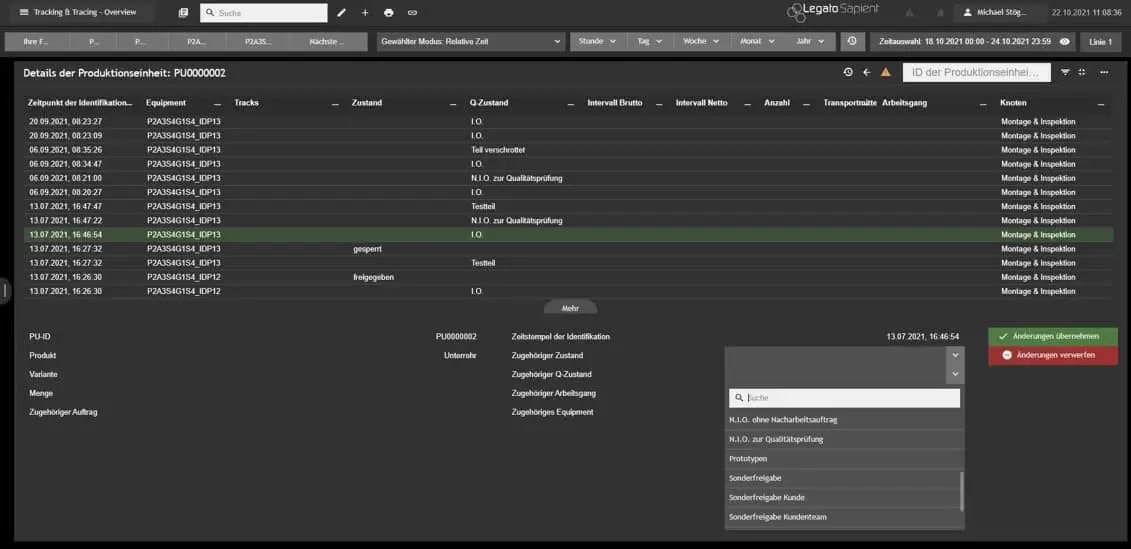
Tracking data can be added or changed with the appropriate rights. This can include changing a quality status in order to block the component for further subsequent processes if it is changed to “not OK (n.i.O.)” and to trigger follow-up actions, such as ejection or reworking in production. Selecting the data record by double-clicking activates an editing mode.
Step 7: Analyzing the PU history
In edit mode, it is possible to change the status of the PU (e.g. released, blocked) or the Q status (e.g. n.i.O. for quality inspection), among other things. A preconfigured selection list with the possible states makes it easy to select the parameters. This PU history is updated or extended when the changes are accepted.
FAQ: Important questions about Track & Trace
What is Track and Trace in production?
Track and trace enables traceability in production. With the appropriate MES software, you can call up the exact production steps and status messages at any time. The term “MES traceability” has also become established for this.
In component traceability, the production units are provided with a so-called PU ID. By recording machine data in real time, you can see the status of a specific production unit at various levels and take appropriate action.
What is the importance of rework in production?
Rework includes all processes that take effect in the event of faulty products and serve to eliminate these faults so that a fault-free product can be delivered.
Reworking in production can be associated with considerable additional work and costs. With the help of a suitable and powerful MES software solution, plant and production managers can track production units and minimize rejects and the resulting costs.
Why is production traceability important?
Production traceability (track & trace or traceability) allows you to determine when and where a product or unit was manufactured and where possible errors occurred at any time. In this way, you can determine the cause of rejects and recall products if unexpected problems occur.
Get in touch!
Would you like to know more about our solutions? Then please write us using the contact form. My colleagues and I look forward to exchanging ideas with you.

Dominik Weggler
Head of Sales Germanedge
Targeted maintenance planning in the industry
Excel or paper-based coordination and documentation of maintenance activities is neither efficient nor reliable. The TÜV requirements regarding documentation and archiving can also be met in this way, but only with extremely high effort and a certain susceptibility to errors. Demand-oriented maintenance can only be ensured with considerable effort.
The advantages of targeted maintenance and maintenance planning via software at a glance:
Why is targeted maintenance planning important for a company? What are the reasons for this?

If the coordination of maintenance activities is based on manual processes and takes place without any automation, the result is often so-called over- or under-maintenance. In the case of over-maintenance, maintenance capacities are unnecessarily planned, expensive spare parts and operating materials are consumed and valuable production time is wasted. Under-maintenance leads to unnecessary wear and tear and therefore to unplanned production downtimes with time-consuming and expensive ad hoc repair work. This in turn destroys the entire production plan and causes massive costs.

What solutions are there in maintenance management?

To avoid over- and under-maintenance and unplanned machine downtime, Total Productive Maintenance (TPM) has been practiced for many years as a key function of the lean management philosophy. Total Productive Management, also known as Total Productive Maintenance, forms a framework based on eight pillars:
- Targeted continuous improvement
- Autonomous maintenance
- Planned maintenance
- Competence management
- Quality maintenance
- Start-up management
- TPM in administrative areas
- Occupational safety, health and environmental protection

Building on these pillars, digitalization offers unimagined opportunities to shape and live continuous improvement. Production-related maintenance software with machine data acquisition enables autonomous maintenance teams to carry out targeted action management. The planning and execution of measures and maintenance work can be planned efficiently based on the machine data.
Documentation and analysis are carried out simultaneously in the same system without media discontinuity. The Legato Sapient MES software offers a tailor-made platform for establishing the objectives of the TPM philosophy on the store floor.
What does our solution for autonomous maintenance look like?

Legato Sapient creates digital “maintenance cards” in which the measures carried out are documented, archived and processed in accordance with TÜV requirements. Responsibilities and maintenance intervals are clearly defined. The system automatically calculates due dates based on both time and value using the prescribed, maintenance-relevant criteria. The maintenance team is guided by the interactive dashboards in Legato Sapient and can concentrate on ensuring a trouble-free and efficient production process. Operations is made up of two components, TPM planning and TPM orders.

Maintenance planning: How to create TPM plans

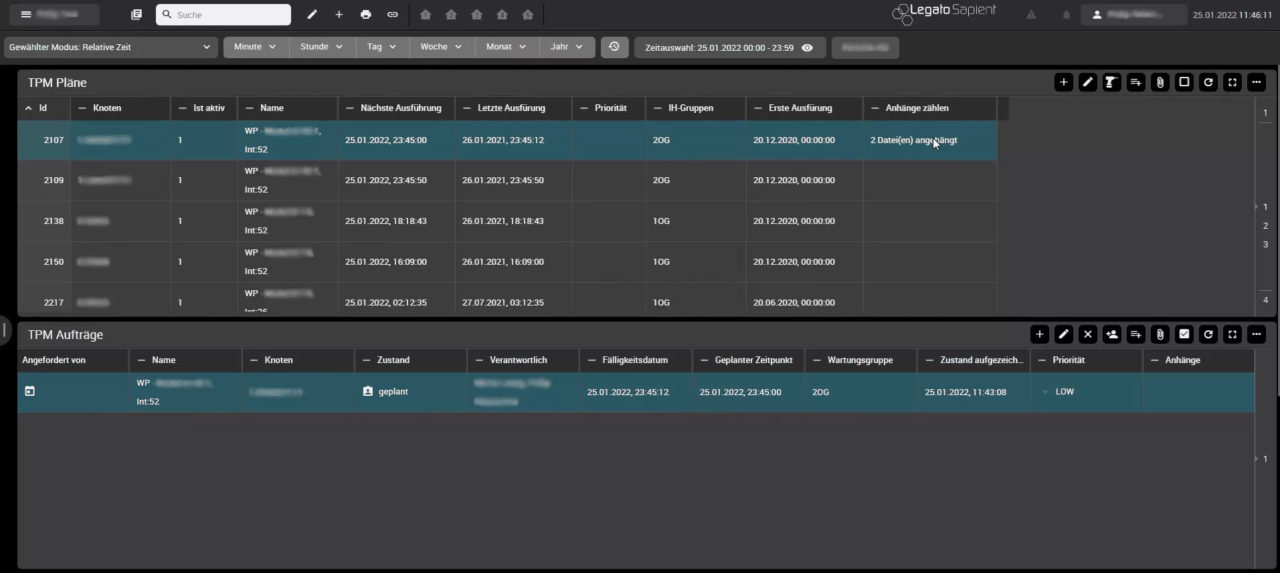
The TPM Plans boardlet is used to create maintenance plans that are individually assigned to individual systems or machine groups. This creates an overview of the maintenance plans for a selected area with all maintenance-relevant attributes (ID/name, start time, next due date, last execution, assigned personnel, priority). Furthermore, maintenance plans contain precise descriptions of the work content and required components.
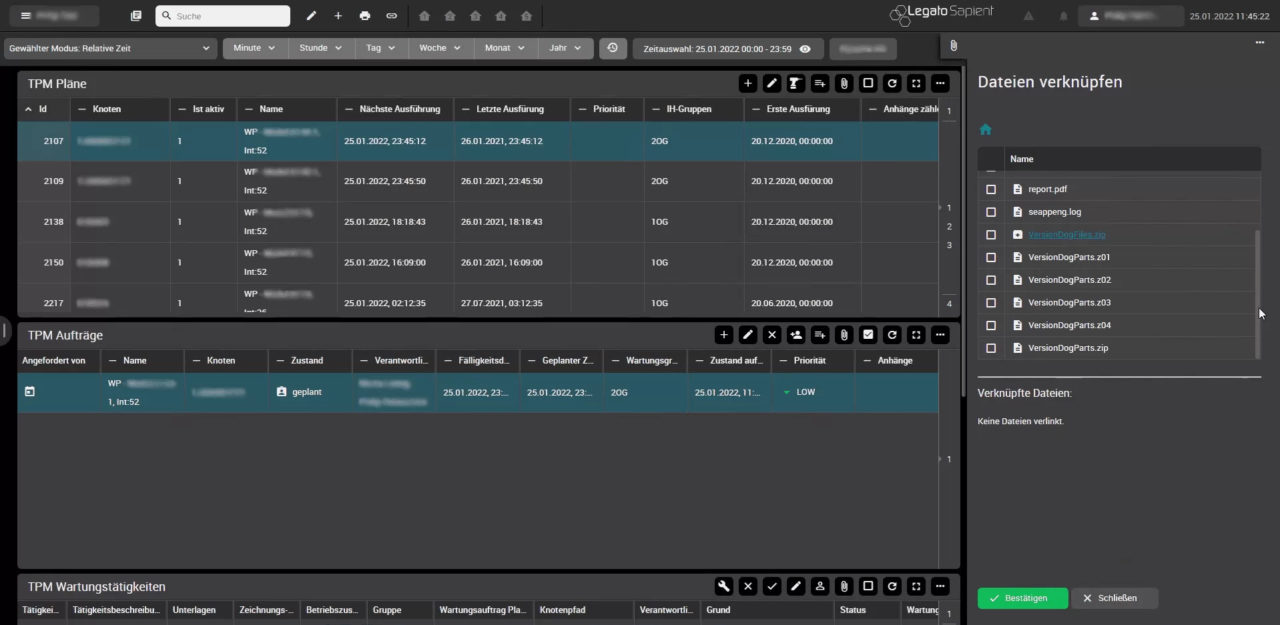
The visualization shows all available maintenance plans for the selected (sub-) node in the company structure and is enriched with information such as the next due date, last completion and the responsible maintenance group. The maintenance plans can be edited by manually creating new maintenance plans or automatically importing them via csv files. Furthermore, existing maintenance plans can be adapted and configured and files can be attached.

Autonomous maintenance: How to create TPM orders

TPM orders are generated from TPM plans using various triggers. These trigger a maintenance order based on time, value or message. It is also possible for the system operator to submit an ad-hoc maintenance request. Legato Sapient triggers time-based orders as soon as a defined interval of days or shifts has elapsed. For value-based triggering, online data from the control system is evaluated, which triggers an order when threshold or limit values (e.g. number of units produced, throughput or vibration values) are reached. Legato Sapient creates message-based jobs when the control system sends a dedicated alarm.

All due maintenance orders are listed in a boardlet for the preparation of execution (commissioning, confirmation, etc.). This visualization provides the maintenance team with an overview of all open maintenance orders for the selected (sub)node. It contains relevant information such as the planned due date, the trigger and the current status. The overview of all due maintenance orders enables the maintenance manager to plan resources in a targeted manner and the maintenance teams to have a list of open tasks.
For the structured processing of maintenance orders and management of activities, the orders are assigned to one or more persons from the corresponding maintenance group. Legato Sapient provides all relevant information for processing the orders. This includes detailed activity descriptions, status, required material or file attachments (e.g. operating instructions and manuals).
Maintenance management for TPM analysis

To make the aforementioned benefits of continuous process optimization tangible, Legato Sapient includes an additional module for TPM analysis. This shows the current situation on the store floor at an operational level. System status and alarms as well as the status of maintenance orders can be visualized and monitored. In retrospect, it enables the evaluation and comparison of historical data, in particular alarms, maintenance-specific KPIs (MTTR, MTBF, system availability, etc.) and the maintenance history (tasks, time stamps, responsibility). This makes it possible to prove the increase in performance and establish an active CIP.

The added value of autonomous maintenance in industry
The described (digitized) process with the help of Legato Sapient results in added value for you as a customer in many ways:
- Replacement of paper and/or Excel-based maintenance activities
- Significant paper reduction on the way to paperless production
- TÜV-compliant – in terms of documentation requirements and archiving
Demand-oriented coordination of maintenance activities to avoid expensive over-maintenance (maintenance activities are carried out too often)
- Avoid wasting expensive production time
- Avoid waste of maintenance capacities
- Avoid waste of expensive spare parts/operating materials
Demand-oriented coordination of maintenance activities to avoid expensive under-maintenance (maintenance activities are carried out too infrequently)
- Avoidance of unplanned production downtimes (due to unplanned system failures) with expensive ad-hoc repair work
- Avoidance of quality defects in the manufactured products due to non-removal of chips, missing operating materials, etc.
- Avoidance of safety risks due to faulty safety doors, etc.
Coordination of due maintenance activities by the maintenance manager or the TPM coordinator
- Automatic notification of the relevant groups of people (maintenance manager, TPM coordinator) on the due date
- Assigned maintenance activities appear in a “to-do list” for the respective maintenance groups
Transparency in maintenance planning
- “Preview” of future maintenance: Maintenance counters can be viewed in the system at any time
- Central documentation of all maintenance activities carried out, including responsibility and date
- Possible correlations between faults and maintenance intervals can be identified
Click Demo: Maintenance planning and maintenance management with Legato Sapient
The following screenshot shows the maintenance plans available in the system and maintenance orders due for the selected area (node in the production structure).
In addition, various information, such as the next due date, the last execution or the responsible maintenance group, is displayed – however, the view can be flexibly customized.
Adjustment of maintenance planning in the overview
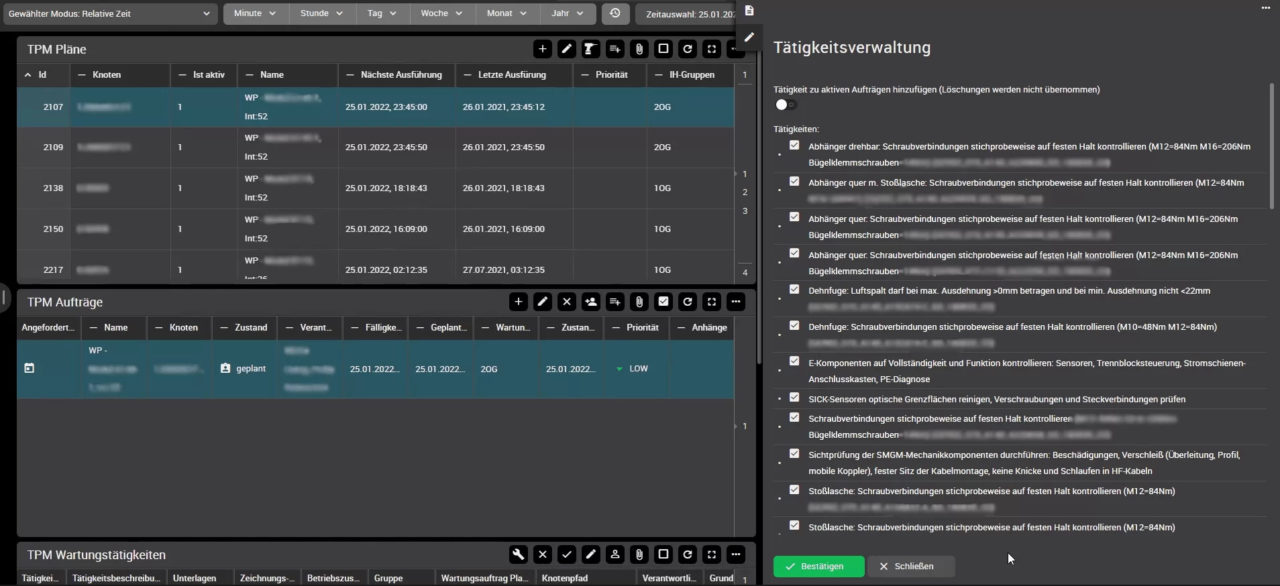
It is also possible to edit the maintenance plans in this view. For example, existing maintenance plans can be adapted or new maintenance plans can be created. In addition, the system also offers an automated import of maintenance plans, e.g. via csv files. A selected maintenance plan (see line highlighted in blue) can be edited using the pencil icon at the top right of the maintenance plan boardlet. For example, the activities within the maintenance plan can be edited or adjusted.
Additional information on individual maintenance plans
When a maintenance plan is selected (see line highlighted in blue), the triggered, due maintenance orders appear in the lower part of the screenshot (maintenance orders are triggered from maintenance plans, e.g. based on time or value).
Important additional information on the maintenance orders due is also displayed, such as planned due dates, the trigger and the current status of the maintenance order. One or more people from the maintenance group can then be assigned to a maintenance order.
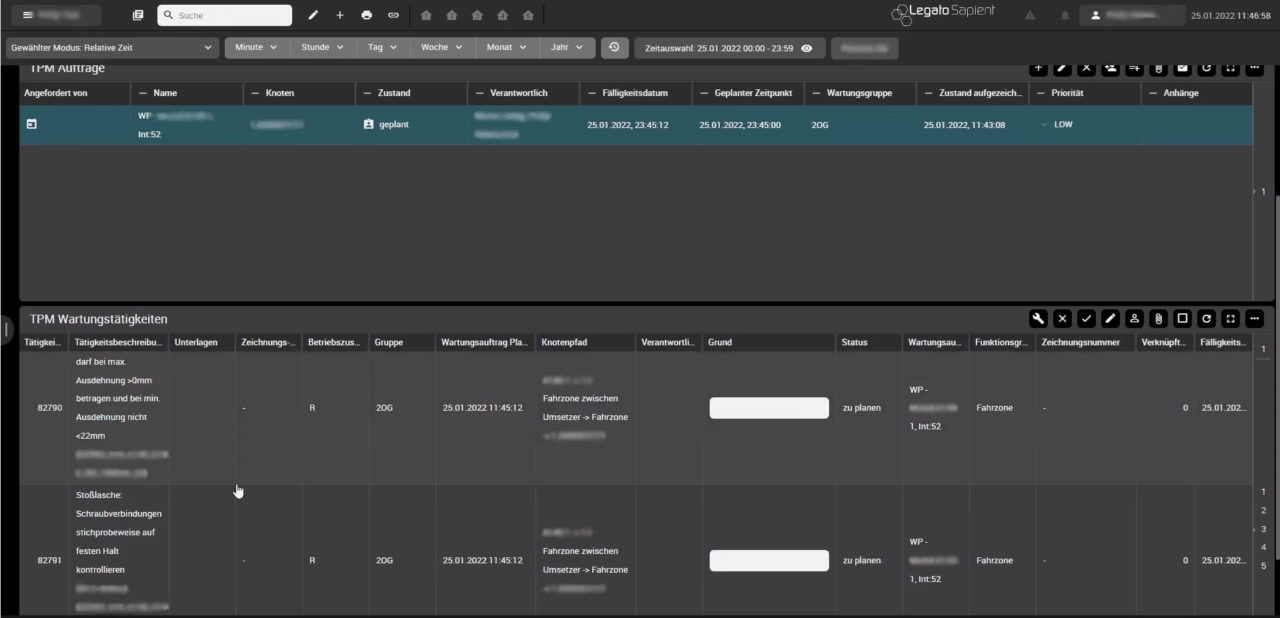
The screenshot opposite shows all open maintenance activities in the selected area, including the corresponding filter settings. The display of relevant additional information (columns), such as activity description, reason, status, etc. can be flexibly adapted.
The activities within a maintenance order are then processed by a responsible person (typically assigned to the maintenance order or activity in advance by the maintenance manager or the TPM coordinator).
Once all activities of a maintenance order have been completed (including documentation of completion by the maintenance employee), it is closed and the corresponding due date counter is reset.
Frequently asked questions about maintenance management and autonomous maintenance
What is maintenance management?
Maintenance management refers to the control of the entire maintenance planning on a technical and administrative level. This includes the inspection, maintenance and repair of machines, but also the improvement of work processes. An analytical and strategic approach, for example when defining time intervals for maintenance activities or assigning responsibilities, is essential for holistic maintenance management. The aim of maintenance planning is to keep the costs of repairs low while increasing the overall effectiveness of the plant.
What strategies are there for maintenance?
In maintenance management, a distinction is made between corrective, preventive and predictive maintenance. In corrective maintenance, machines are only repaired when they break down. Accordingly, there are no costs for maintenance and maintenance planning, but failures lead to unplanned system stops, the machine may produce significantly more rejects due to wear and tear and the life cycle of the machine is significantly reduced.
In prospective or preventive maintenance, the management of maintenance is based on the manufacturer’s specifications or empirical values for MTBF (mean time between failure). This increases planning reliability for maintenance and the life cycle of the system can be extended. However, unforeseen system stops can still occur, as maintenance is based on statistics and not on the actual condition of the system. This can also lead to a machine being serviced faster than necessary, resulting in additional costs for the company.
Predictive maintenance is condition-based and is therefore geared towards the current condition of the system. The basis for this is provided by real-time data that is collected using sensors and modern measurement technology and interpreted by an AI (machine learning solution). The more precisely the maintenance software is tailored to the system, the more efficiently maintenance can be carried out.
Is predictive maintenance management worthwhile?
Predictive maintenance management allows you to significantly optimize maintenance costs and downtimes. This gives you an important competitive advantage. Plant maintenance also helps to conserve resources, as you can use the machines over the long term. The prerequisite is that the maintenance software is precisely tailored to your system and production.
Get in touch!
Would you like to know more about our solutions? Then please write us using the contact form. My colleagues and I look forward to exchanging ideas with you.

Dominik Weggler
Head of Sales Germanedge
HMI Scada systems close the gap between MES and store floor
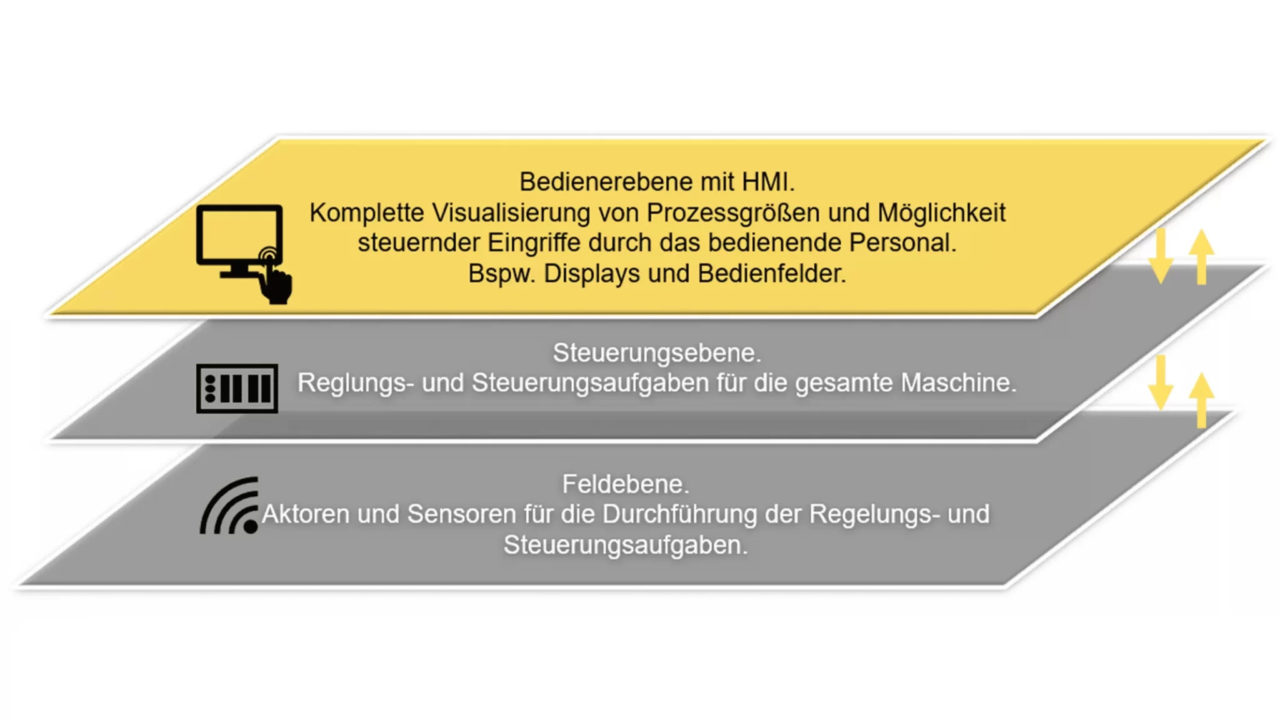
The separation between the control system level (MES) and the HMI, analogous to the classic automation pyramid, is often still common practice in manufacturing companies. However, heterogeneous system landscapes are not competitive in the long term. System discontinuities and a non-continuous flow of information are the order of the day, as important information from the HMI is usually only available locally as fat client solutions, although it would also be necessary elsewhere. Another not insignificant cost factor in the structure outlined is the expensive and maintenance-intensive hardware and middleware of the terminals.
Digitalization opens up new opportunities here: it is now possible to move away from the existing, local fat client installations in the HMI area, whereby a fail-safe network is required as a production-critical medium.
Better control and analysis of your MES data through integration of SCADA-MES and SCADA-HMI
The modular MES/ SCADA Legato Sapient can be expanded to include HMI functionality. With Legato Sapient in combination with our web-based HMI module, you not only have all plant information stored centrally and visible at a glance, but can also intervene directly in the plant process to control it. This not only closes the gap between the control level and HMI, thus ensuring a seamless flow of information without losses as a “single point of truth”, but also significantly reduces the costs for terminal hardware and middleware – standard hardware with a web browser is sufficient.

The integration of the web-based version of the HMI into the control level (MES) offers a number of advantages:
- Consistency & 360° view of production: linking of central MES and decentralized HMI data for full transparency
- Significant cost reduction for hardware and middleware through use of the application in the web browser – therefore more cost-effective hardware and middleware are sufficient
- Lower operating costs thanks to centralized version updates and other changes
- Ideal solution for heterogeneous machine parks: integrated, consistent technology of MES and HMI, independent of the system suppliers
- Reduced costs during system commissioning thanks to the operation of the HMI Designer in the cloud “HMI Designer as a Service”

MES Legato Sapient with HMI module – a combination with added value
The increasing complexity in production requires a complete image of the entire process. This requires data with different levels of detail depending on the application. Legato Sapient with the web-based HMI module combines the decentralized view of the machine with the overall view in the control station, thus ensuring a seamless flow of information and system consistency.
This information must be displayed in an ergonomically sensible way for the operator so that he can quickly grasp it and react accordingly. Legato Sapient with HMI enables system consistency from different perspectives
-
From the user’s perspective:
No time-consuming switching between different systems
Greater transparency, resulting in faster reactions and less machine downtime
-
From a technical perspective:
Project planning: graphic overviews only need to be created once using the integrated, web-based designer and can be used both on HMI terminals and directly in Legato Sapient
Software maintenance/operation: Two systems (even from two manufacturers) merge into one (application support and IT integration)

The HMI module at a glance
- Device-independent, web-based solution: visualizations available anytime and anywhere without expensive hardware and middleware
- Decentralized perspective: Local operating terminal with system-related visualization
- Insight into system data and holistic overviews from Legato Sapient
Server-based solution for graphical process visualization and process-related operation - Support for several hundred individual stations
- Low latency (< 1 second) for production-critical interactions: Data stream without detours via the database
- Control of user-specific functions through rights concept, e.g. for executing safety-critical actions only in the visible area of the system


The HMI Designer at a glance
- HMI Designer as a service: operation in the cloud and therefore reliable support and simple updates
- Quick and easy pre-commissioning of systems at the supplier’s premises thanks to visualization creation (web-based) in the cloud, including live connection of the machine
- Shorter rollout times for the end customer thanks to simple transfer to the customer system
- Automatic standardization through general and customer-specific libraries for graphical elements and their links (e.g. DIN EN ISO 10628 process engineering)
- Simple dynamization through low-code approach similar to Excel formulas

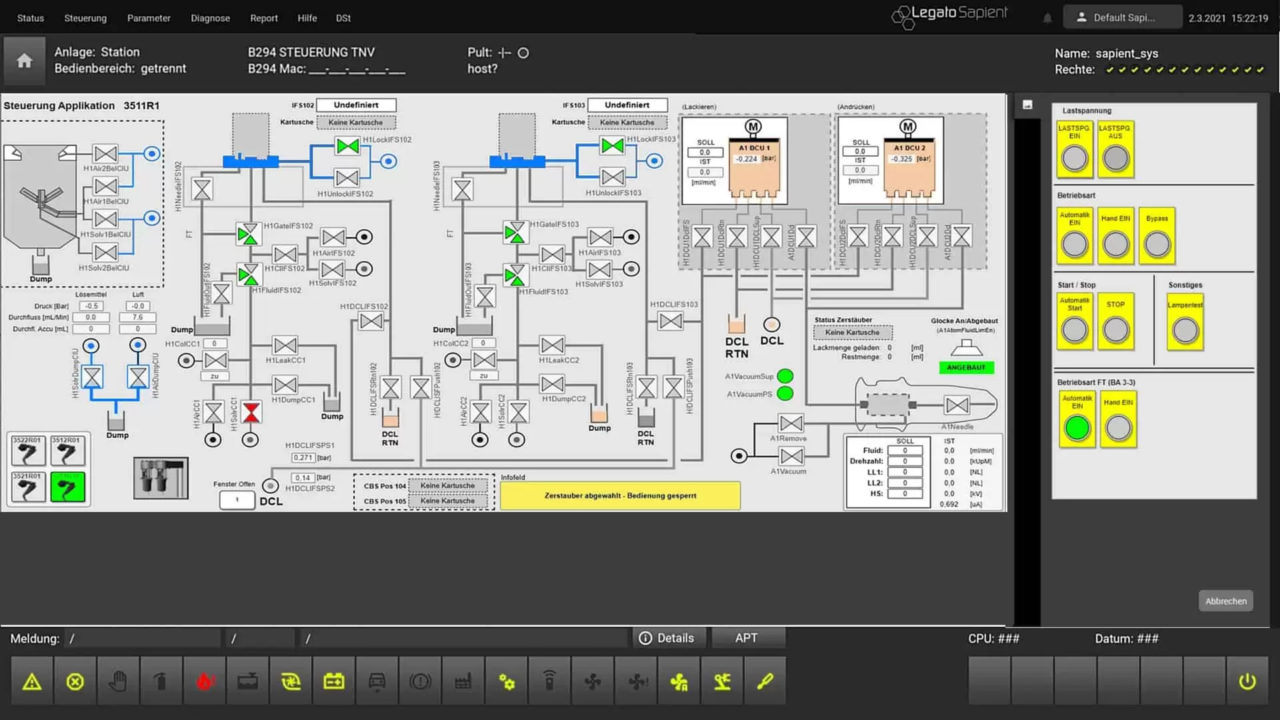
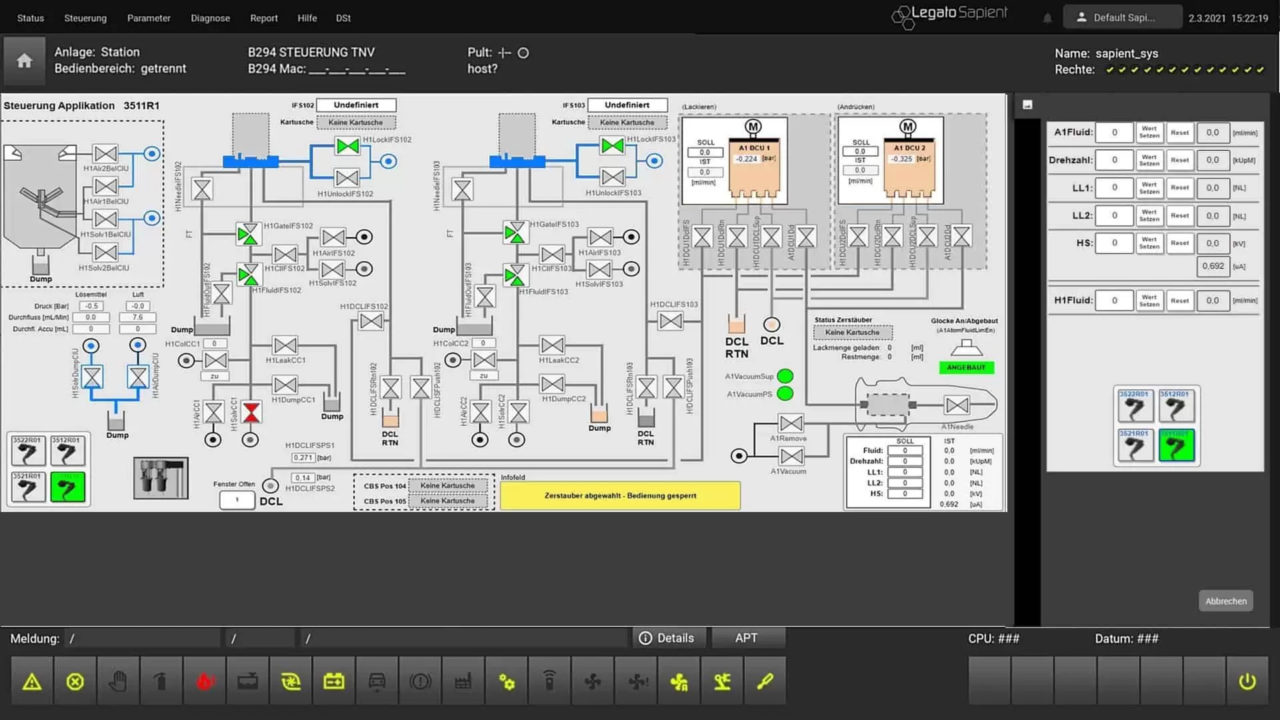
Click demo of the HMI-SCADA system from Legato Sapient
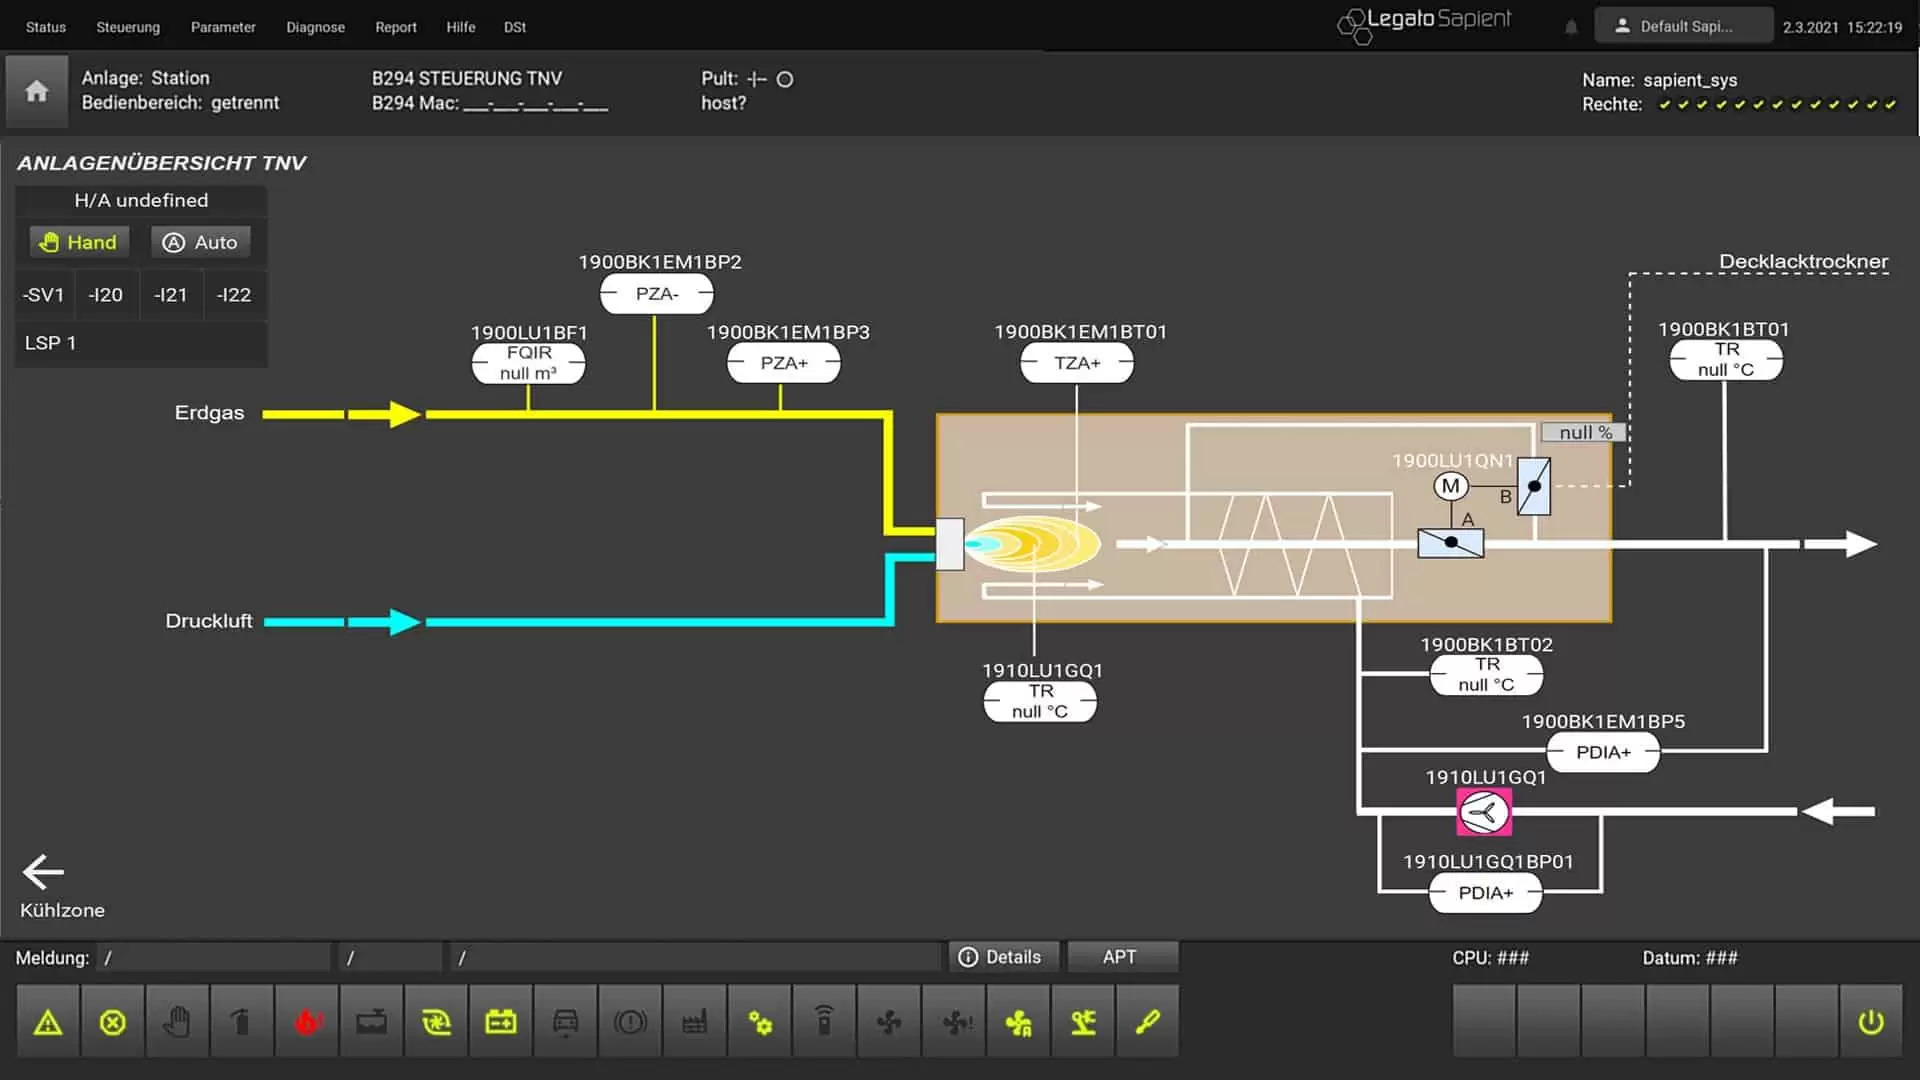
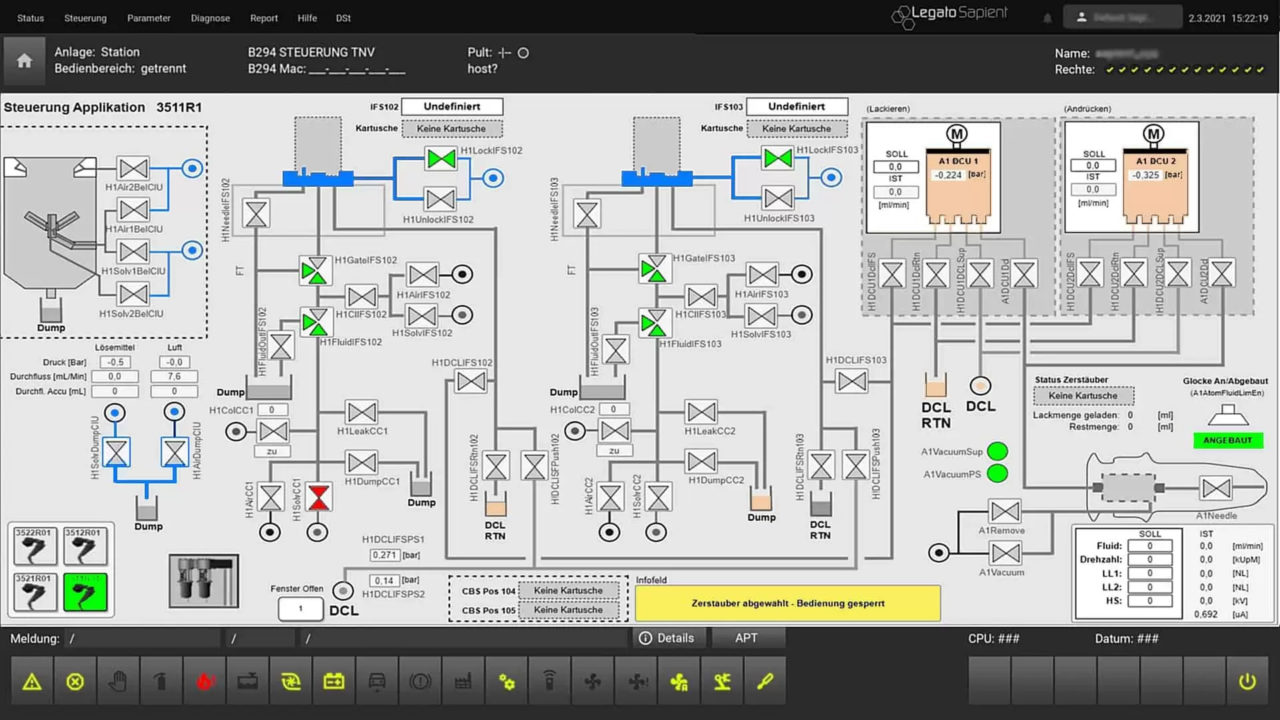
The screenshot opposite shows a typical HMI visualization from the field of process engineering. The top header represents the central control menu of the system-specific HMI application. This is used to navigate between the individual areas and to control the application.
The look and feel of the HMI visualizations can be freely designed using the HMI Designer, while object libraries support the standardization of graphical and functional elements. The following example shows typical headers and footers, whereby the header usually shows the basic information about the HMI visualization. The footer of the HMI visualization replaces the operation of the classic “operator panels” via hardware buttons.
Frequently asked questions about HMI SCADA systems and MES
What is SCADA?
The abbreviation SCADA stands for Supervisory Control and Data Acquisition. In the automation pyramid, SCADA is defined as the level between the control level and the planning level and thus represents the connecting element between direct machine operation or the production process and the planning level of a system. SCADA systems are used to monitor systems remotely and to collect and process data.
What role does the HMI play in a SCADA system?
The interface between man and machine (human-machine interface, HMI) enables workers to operate the machines in a system digitally. Graphic representations of the entire conveyor system, as well as detailed information on temperature, pressure, water flow or similar, provide workers with real-time data. Each process has its own HMI, which can be set and monitored by the worker. The combination of all HMIs in one system forms the SCADA system.
Why install an MES when there is a SCADA system?
A SCADA system simply collects and monitors the data from a plant. In an MES, the data is brought together to make decisions at management level. This includes calculating the OEE, analyzing the data for efficiency losses and implementing strategies to reduce costs and maximize the OEE. SCADA therefore serves the control level, while the MES works at the planning level. Both are essential for Industry 4.0.
Get in touch!
Would you like to know more about our solutions? Then please write us using the contact form. My colleagues and I look forward to exchanging ideas with you.

Dominik Weggler
Head of Sales Germanedge
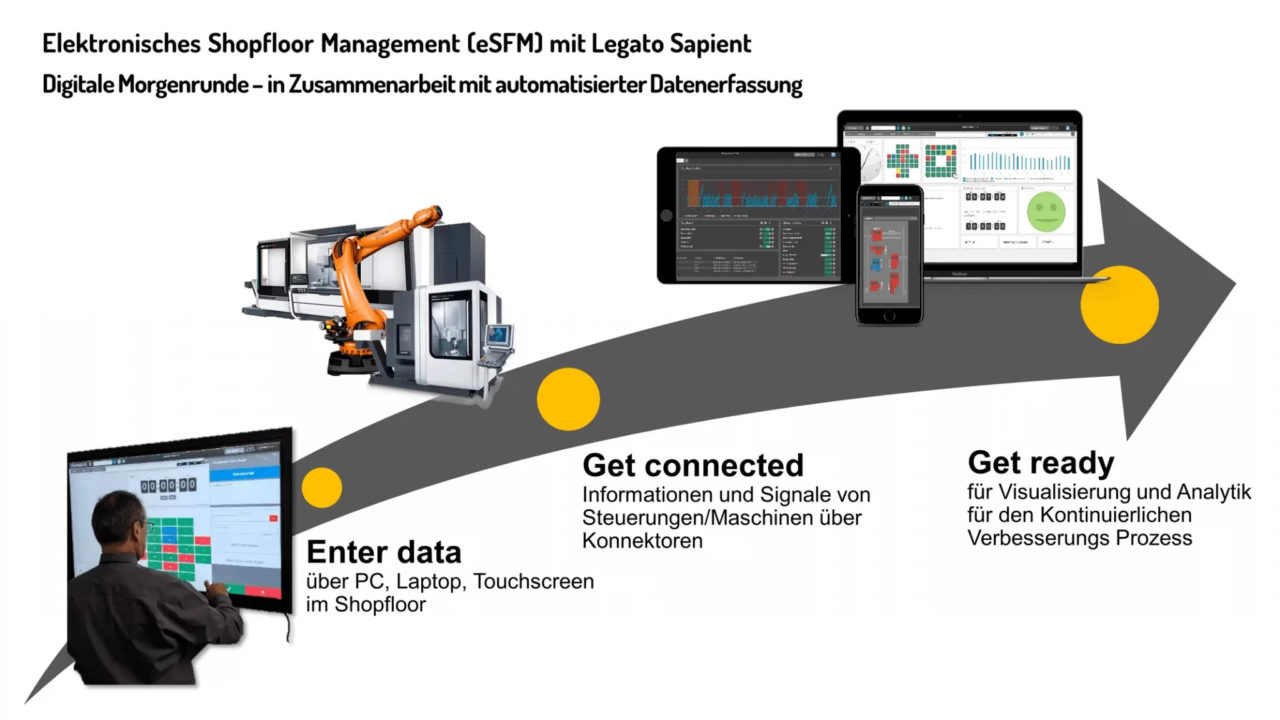
Digital Shopfloor Management
Shopfloor with a system
In the morning meeting in the classic sense, all employees are brought up to date on the basis of overarching standards and topics from the previous day are discussed and the results from this meeting are discussed in front of a pin board. The morning round or Shopfloor Management usually includes topics from the areas of quality, occupational safety, productivity/performance, action control and logistics.
In many production companies, the morning round or Shopfloor Management has established itself as a very effective tool for continuous improvement. Nevertheless, in the age of Industry 4.0 and digitalization (digital factory), new opportunities and possibilities arise as to how existing processes can be adapted and optimized, according to the motto “Traditional things have proven themselves… and still have to change”, while retaining the basic content of the classic morning round.
The digitalization of the morning round as digital Shopfloor Management replaces the previous decentralized preparation of data in tools such as Excel or Power Point. Instead, a centralized store floor system is used for data collection, archiving, provision and processing. This digitalization of the morning round brings with it a number of advantages, which are summarized here as examples in five areas of efficiency:
1. Information transfer across shifts and departments
For the morning meeting in the classic sense, the manual effort required for preparation is often considerable, as the relevant data is compiled and prepared and then posted on the pinboard in paper form. Despite the considerable effort required for preparation, the information is only available locally.
By using a central, database-based store floor system and the corresponding automated provision of data, the information can be accessed anytime and anywhere. This is the only way to ensure that important information is distributed quickly and easily. If, for example, system malfunctions occur, this information is not only important for the participants in the morning round. Rather, this information should be distributed to other areas as quickly and easily as possible.
2. Flexible data analysis as required

As already described, an enormous amount of preparation is required to prepare the data for the classic morning round. If problems are identified, further information that is not available may be important.
By recording the data electronically (automatically and manually) and archiving it, the information is available centrally in the database. In addition, the data is automatically processed in the central store floor system (e.g. in the form of aggregations). The central archiving of data and its preparation allows the creation of flexible analyses without additional preparatory work. Employees are able to flexibly create their own evaluations based on historical data.
By looking at progressions and trends, deviations can be identified directly and dealt with in a targeted manner. All evaluations and visualizations are based on the same original data records, which means that there are no discrepancies between the original data and the calculated data. This makes it easy to drill down to the last detail!

3. Employee motivation

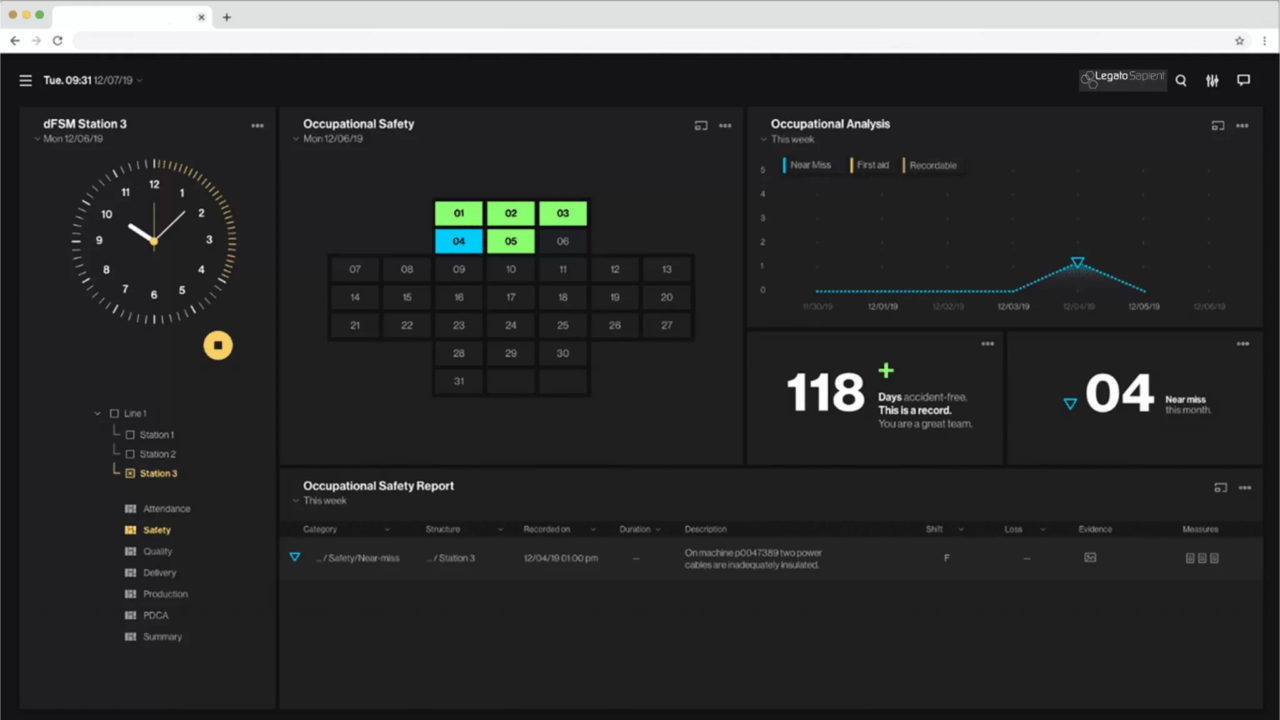
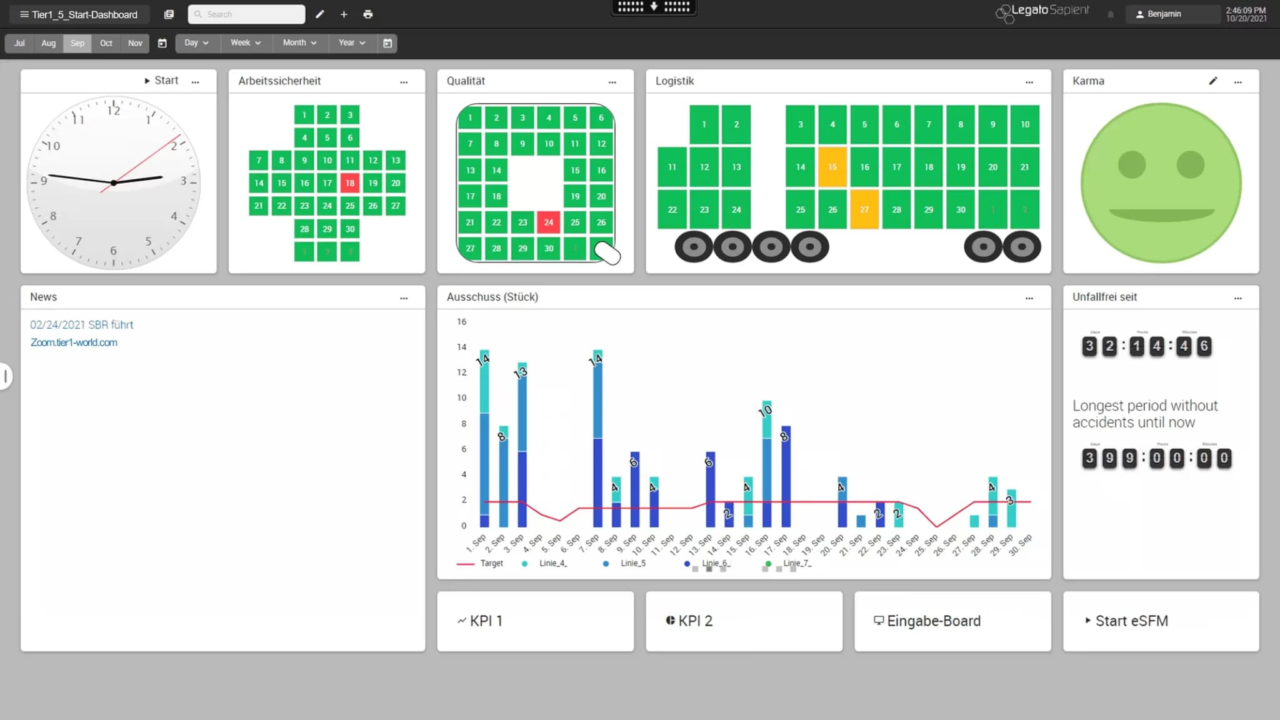
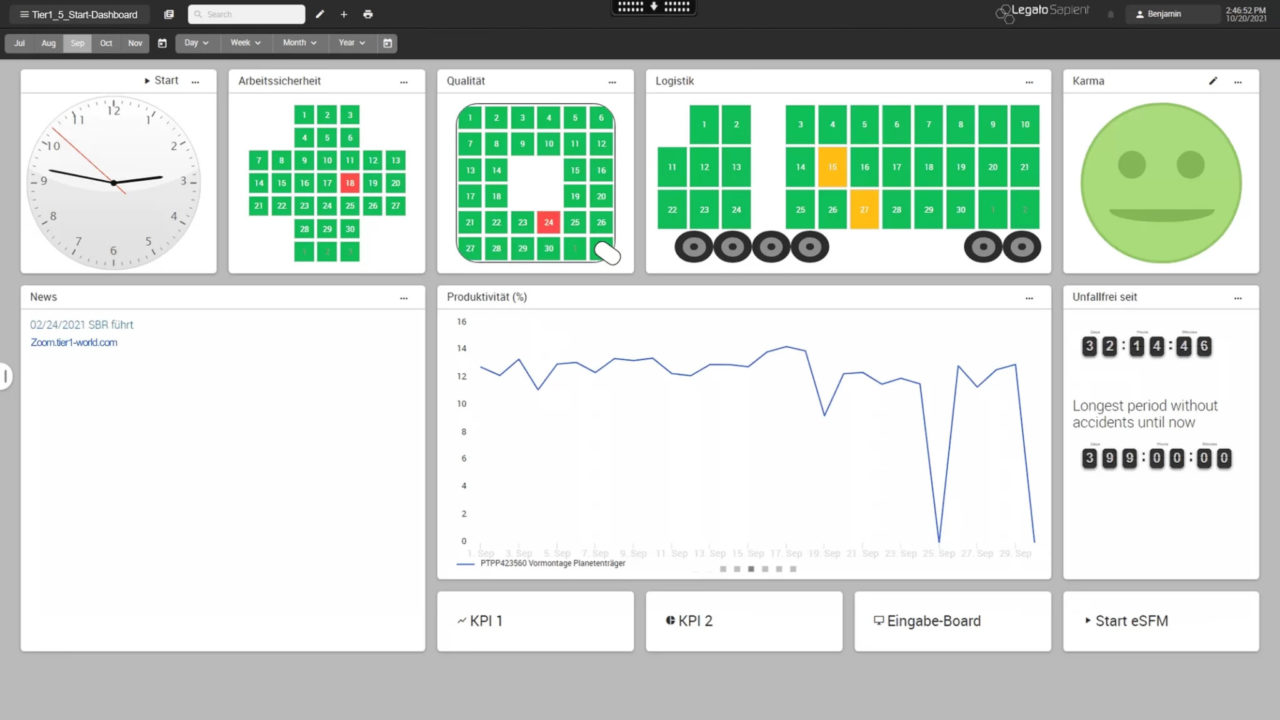
Rational topics play a major role in the classic morning meeting, and the topic of “employee motivation” rarely finds a place in such a meeting. Archiving the data (e.g. accidents at work or quantities achieved) and viewing it over time also allows information that has an impact on employee motivation to be visualized – in this way, “successes” that have an impact on employee motivation can be visualized in the digital morning round. For example, in the area of occupational safety, the topic “Accident-free since…” can be visualized.
The productivity or performance of the previous shift could be underlined in the form of a smiley face, for example. If the planned number of pieces has been achieved, a smiling smiley appears and turns green. Other scenarios are of course conceivable.

4. Visualization of data from different systems in one interface
In certain situations, it is necessary to analyze the process or a specific problem in more detail. This requires additional information, apart from the data from the morning round. Previously, such information was not available on an ad-hoc basis; instead, the employee had to “search” for it in other systems/files. In the age of Industry 4.0, this workflow should be simplified to such an extent that all relevant information is directly available in one view. For digital Shopfloor Management, this means integrating data from third-party systems (e.g. quality and logistics systems) into the central shopfloor system.
5. Communicate efficiently - Shopfloor Management as a platform for dialog
In addition to the contents of a morning meeting presented so far, the CIP (continuous improvement process) and the resulting process improvement is of course one of the core elements. In the classic morning meeting, measures that lead to a possible process improvement are defined and listed on the pinboard, including responsibility and plan date – the measure or its status is only tracked manually.
Store measures centrally in the shopfloor system
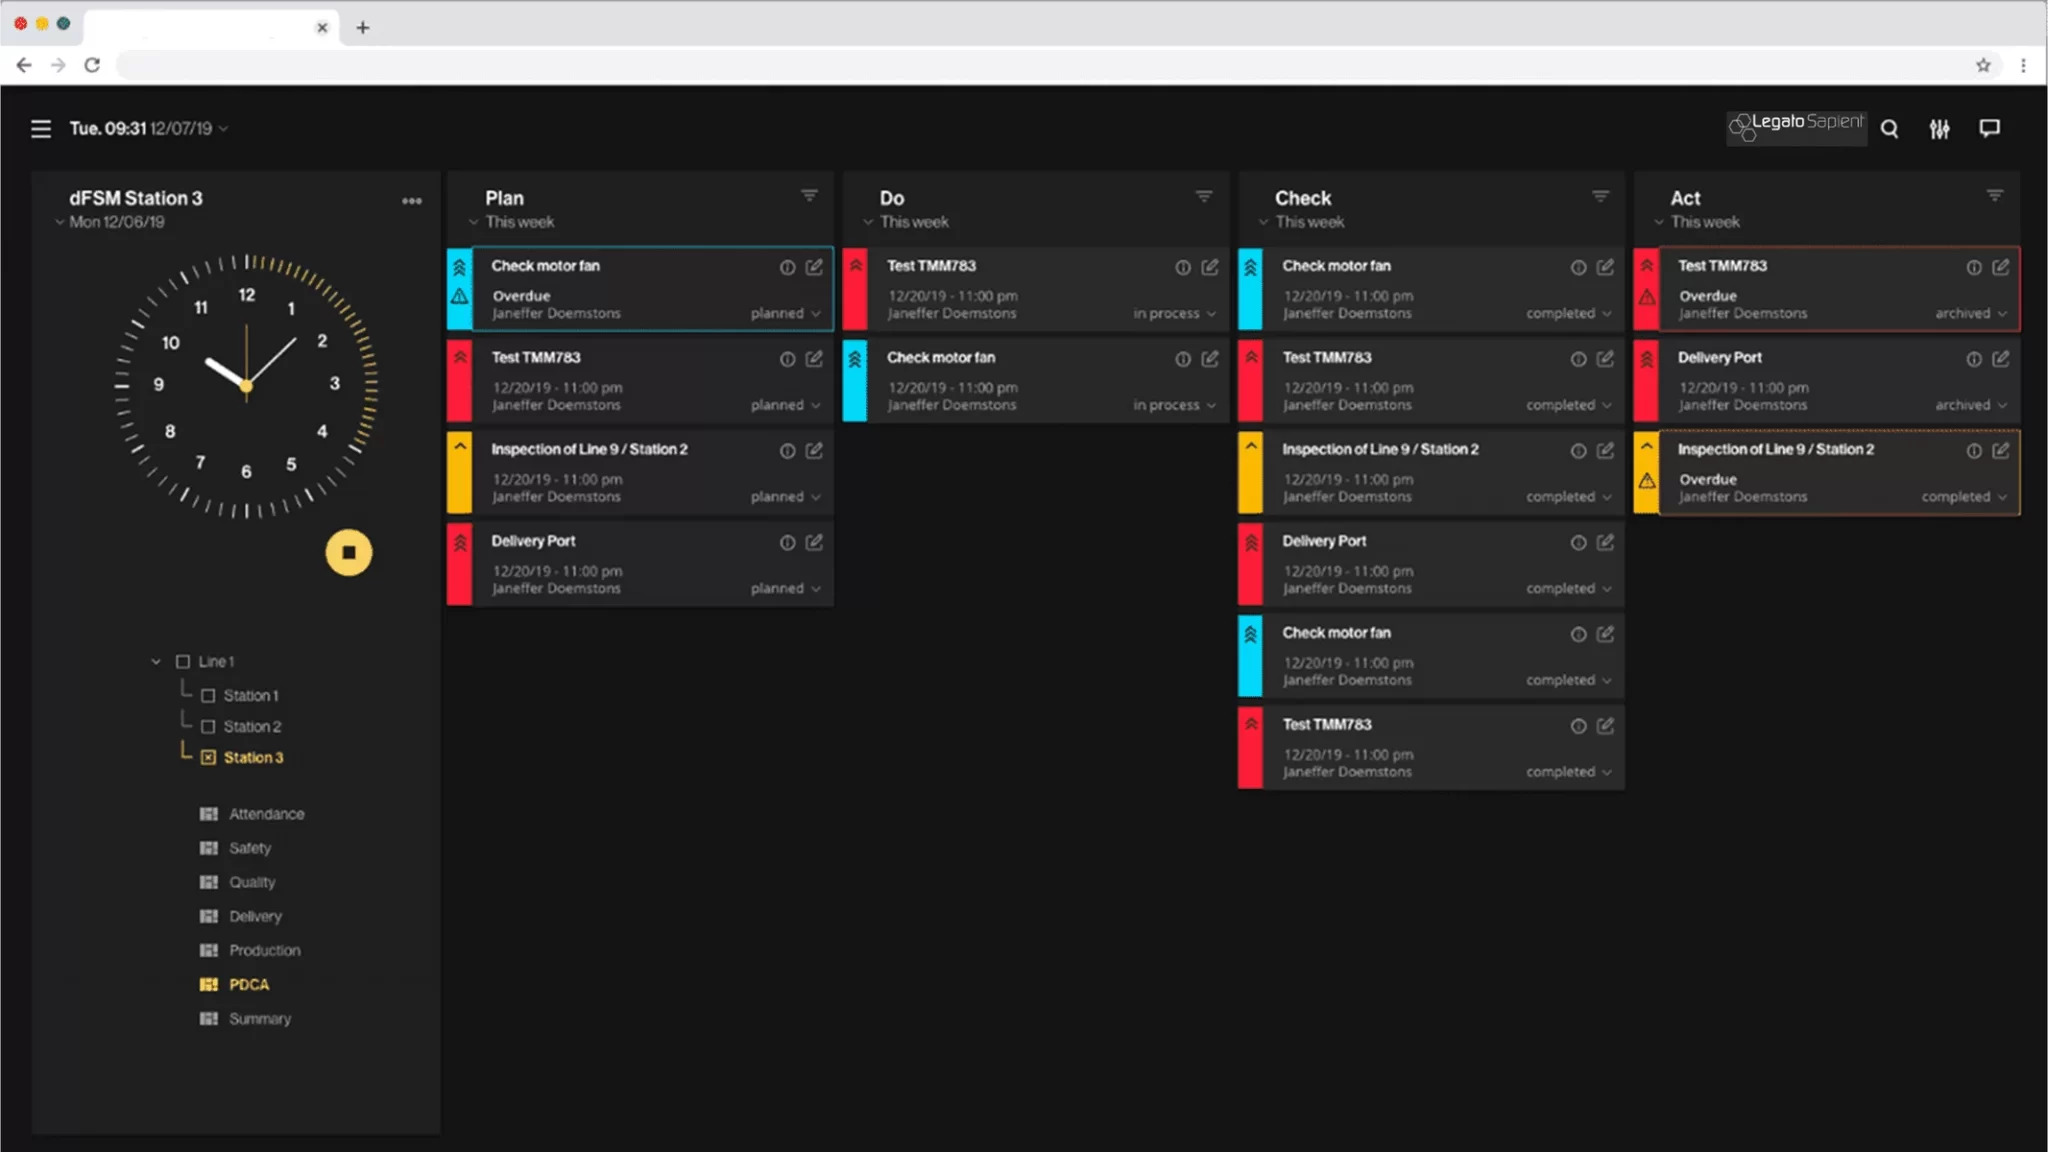
In the context of the digital morning round, the measures are created and archived in the central store floor system – if the status etc. changes, the measure is automatically updated. Nevertheless, the familiar process is retained: As part of the CIP, measures are defined to permanently eliminate regularly occurring problems (e.g. quality, system malfunction, etc.). The PDCA cycle or the Demming circle defines four phases that are run through within the improvement process:
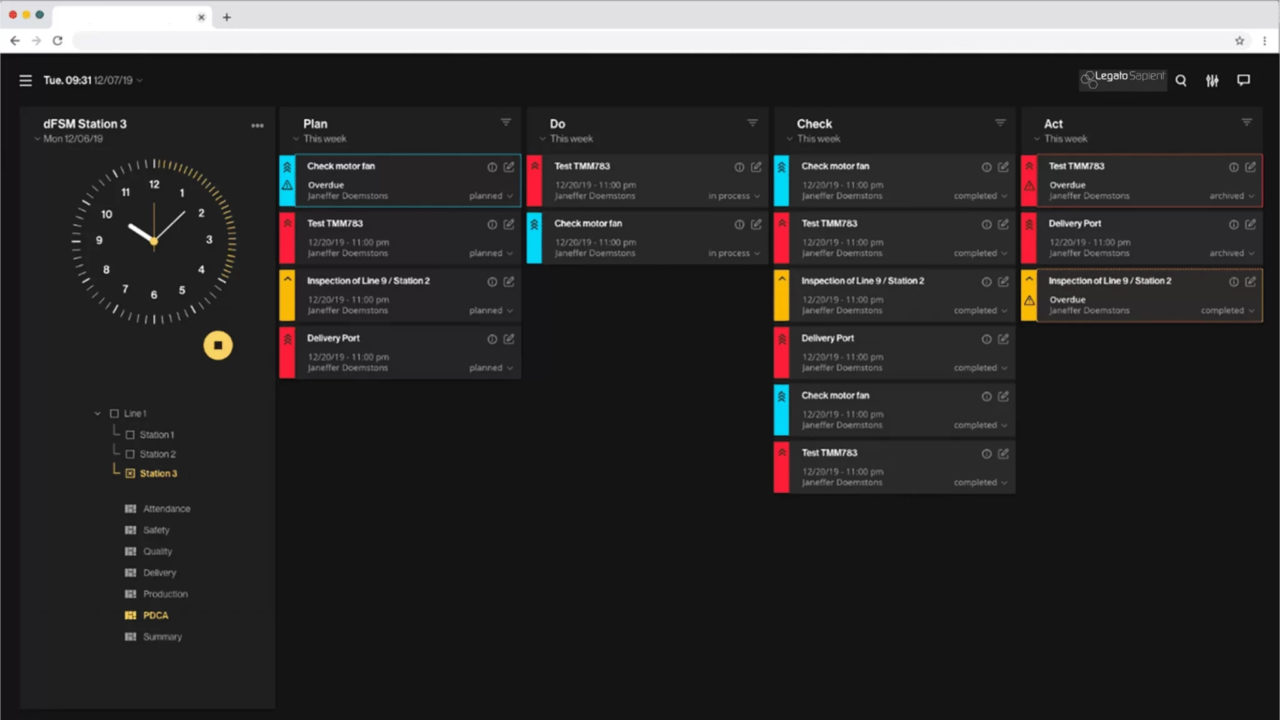
- A measure is defined (P – Plan)
- The measure is then tested (D – Do)
- The result of the measure is carefully checked (C – Check)
- Introduction of the measure on a broad front (A – Act)
Tracking the measures and evaluating them based on the four phases is therefore possible at the touch of a button. If problems or measures arise that cannot be solved directly, additional help from experts is required. The integration of internal communication media allows the temporary involvement of knowledge carriers without the need for personal presence on site.
The digitalization of the morning round creates an interactive, paperless store floor system for all production-relevant topics, from machine to employee – as part of an MES. For the actual system operation, the basic configuration of the MES should already include functions for IT system monitoring and alerting, which only need to be adapted slightly for each application.
Click-Demo: Digital Shopfloor Management
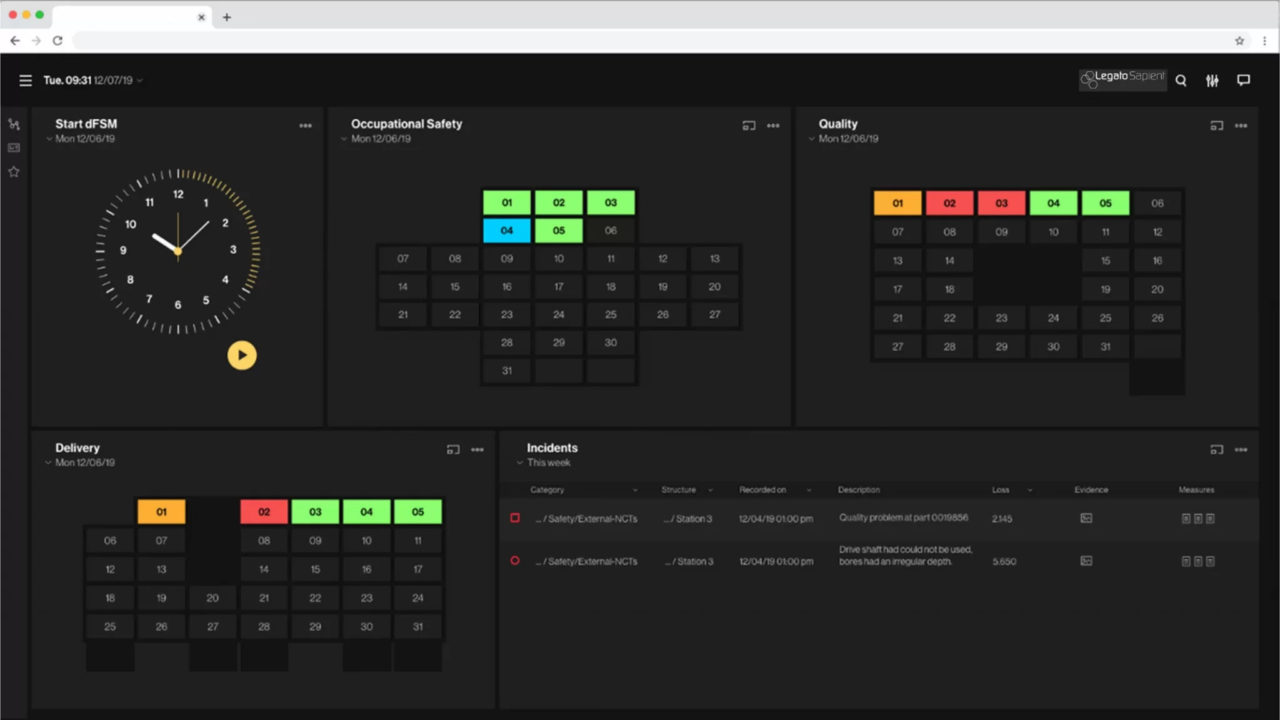
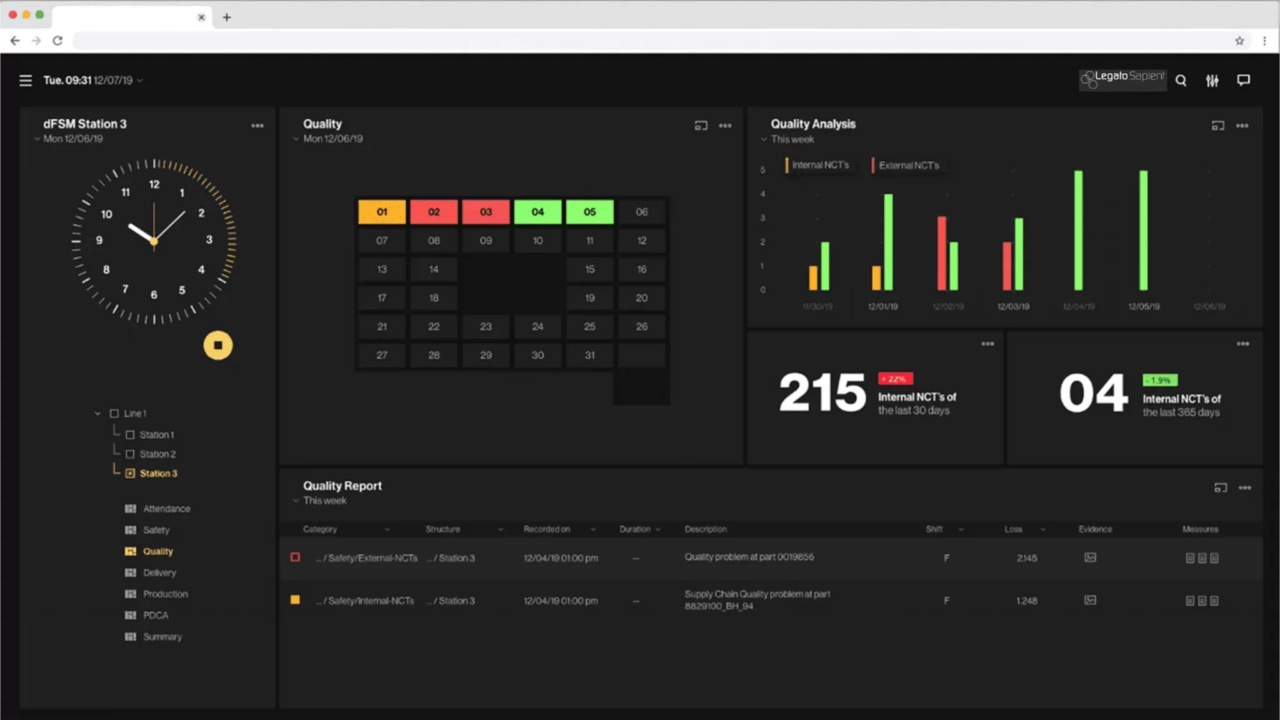
Start screen of the digital Shopfloor Management of the MES software Legato Sapient. 20 minutes morning round is started. The focus is on safety, quality and logistics.
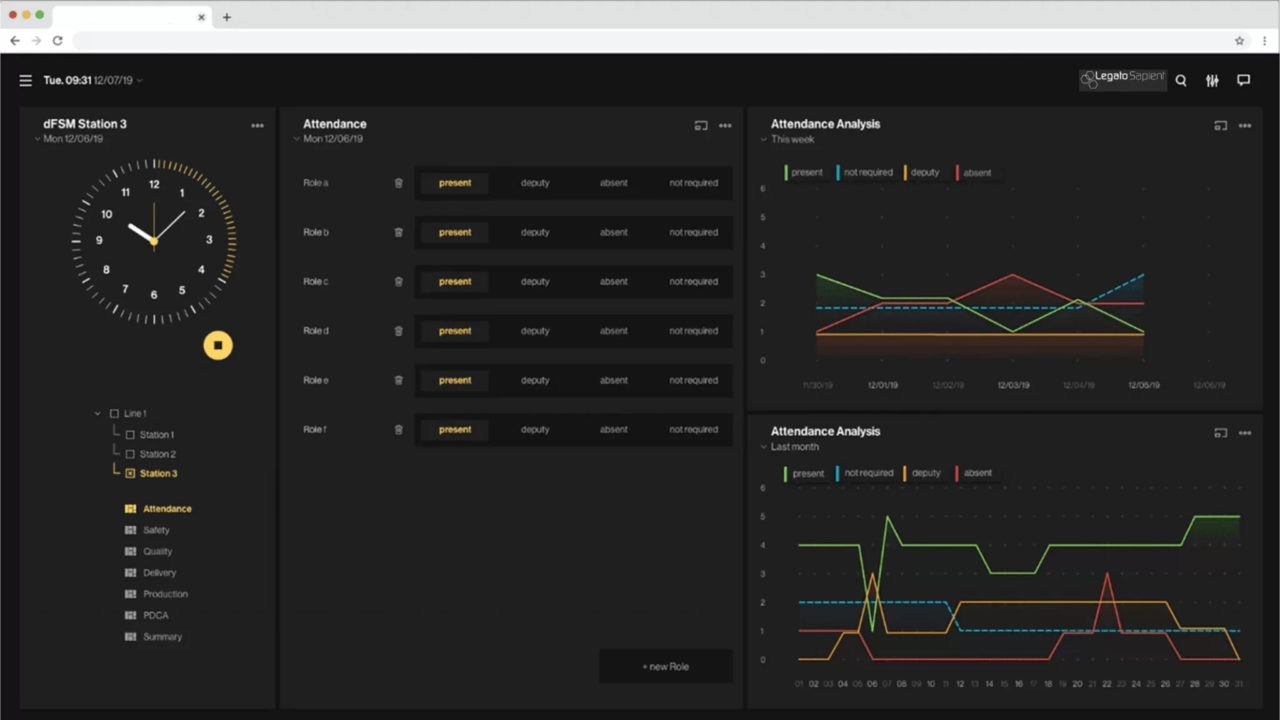
Predefined process with a fixed number of participants or roles. One store floor meeting per shift or day is held for each area/team. Information is aggregated from the bottom up: Incidents (e.g. delays, accidents) or production figures (unit counters, KPIs) are recorded at the bottom at store floor level. The aggregation of these values is then available at a higher level. The news boardlet is used for announcements and general information, where information flows from top to bottom.
Occupational safety
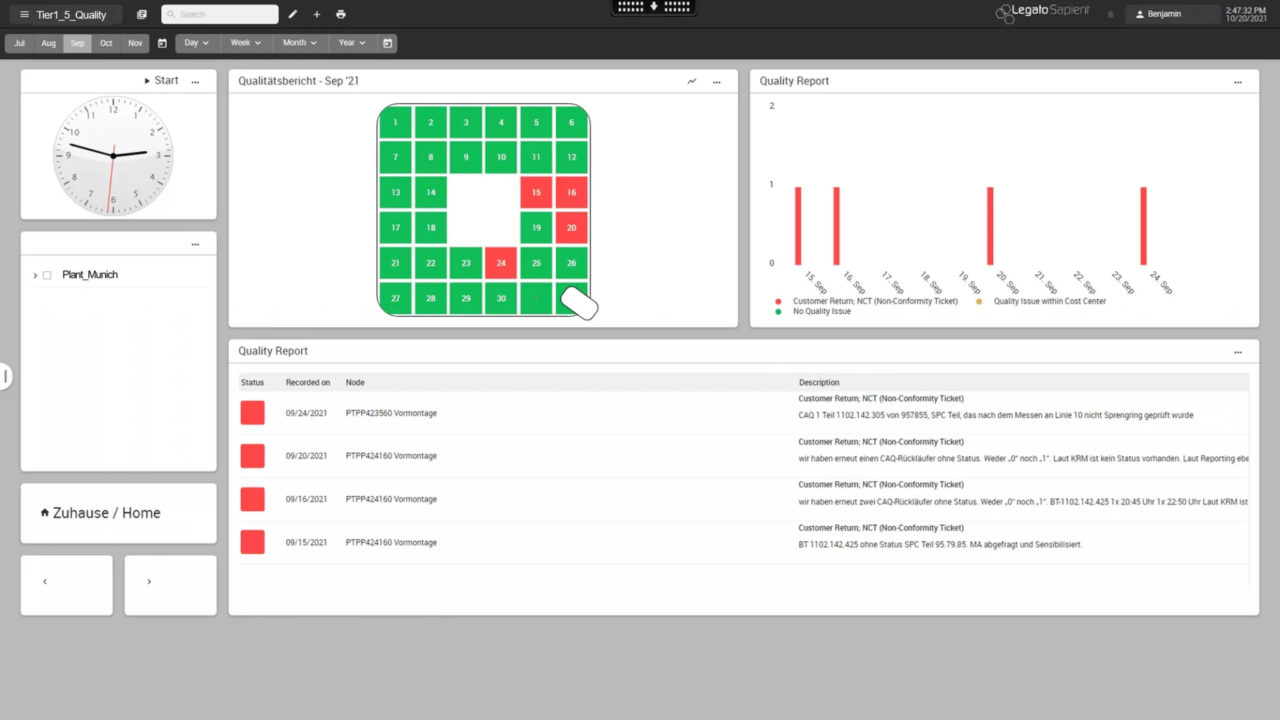
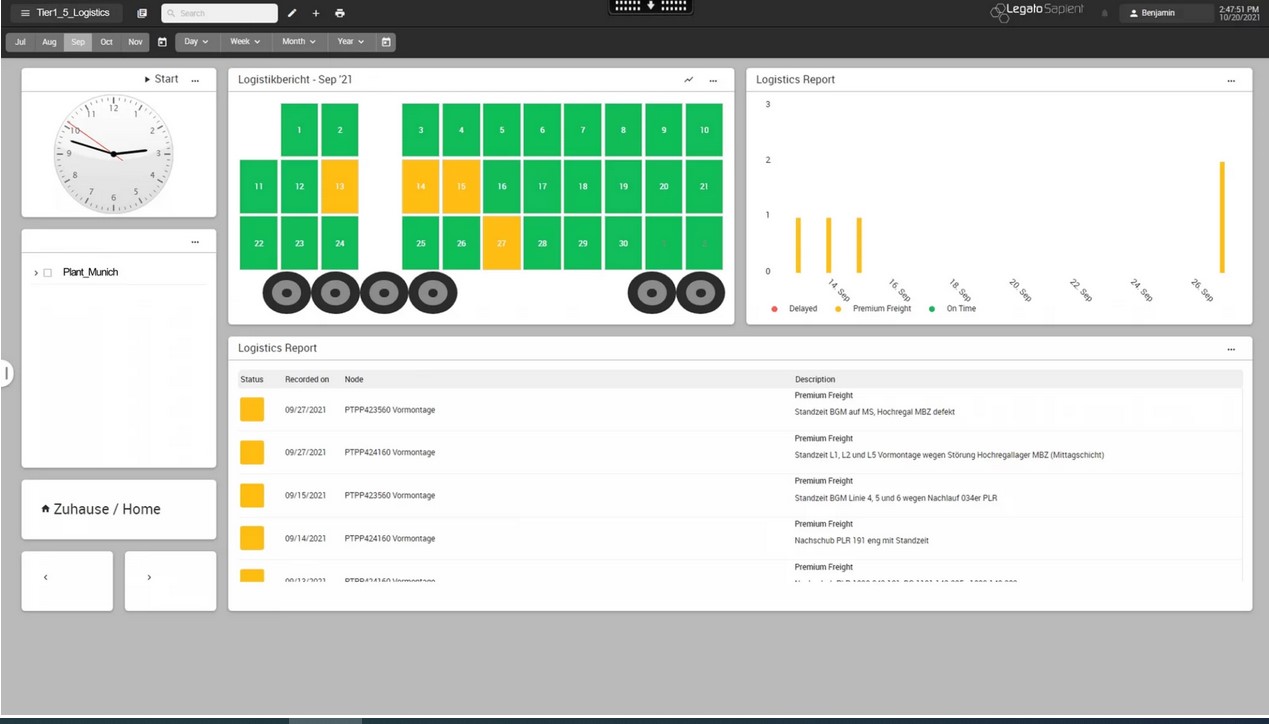
The three calendars Safety, Quality and Logistics are used to record incidents. The option of providing additional customer-specific calendars can be guaranteed. An overview of the existing incidents filtered by area and incident type can be seen at the bottom of the store floor dashboard; when an incident is selected in the list, a window opens with a detailed view of the incident in which it can be edited.
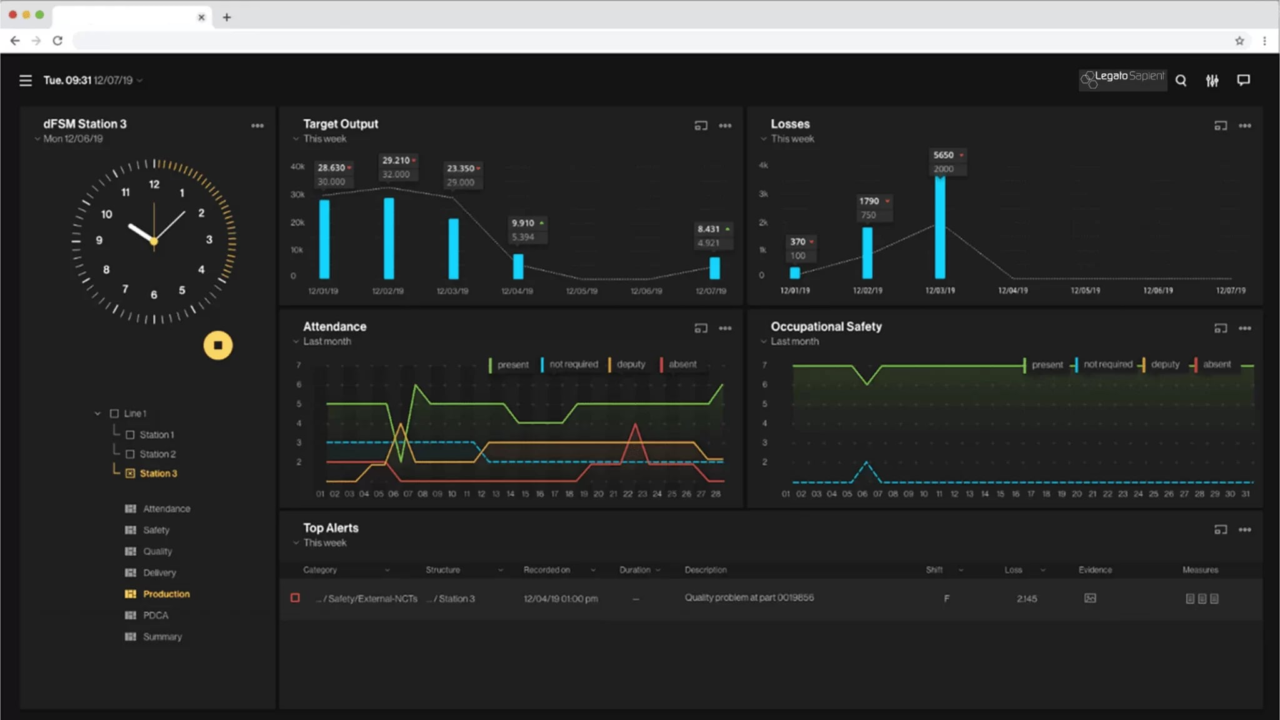
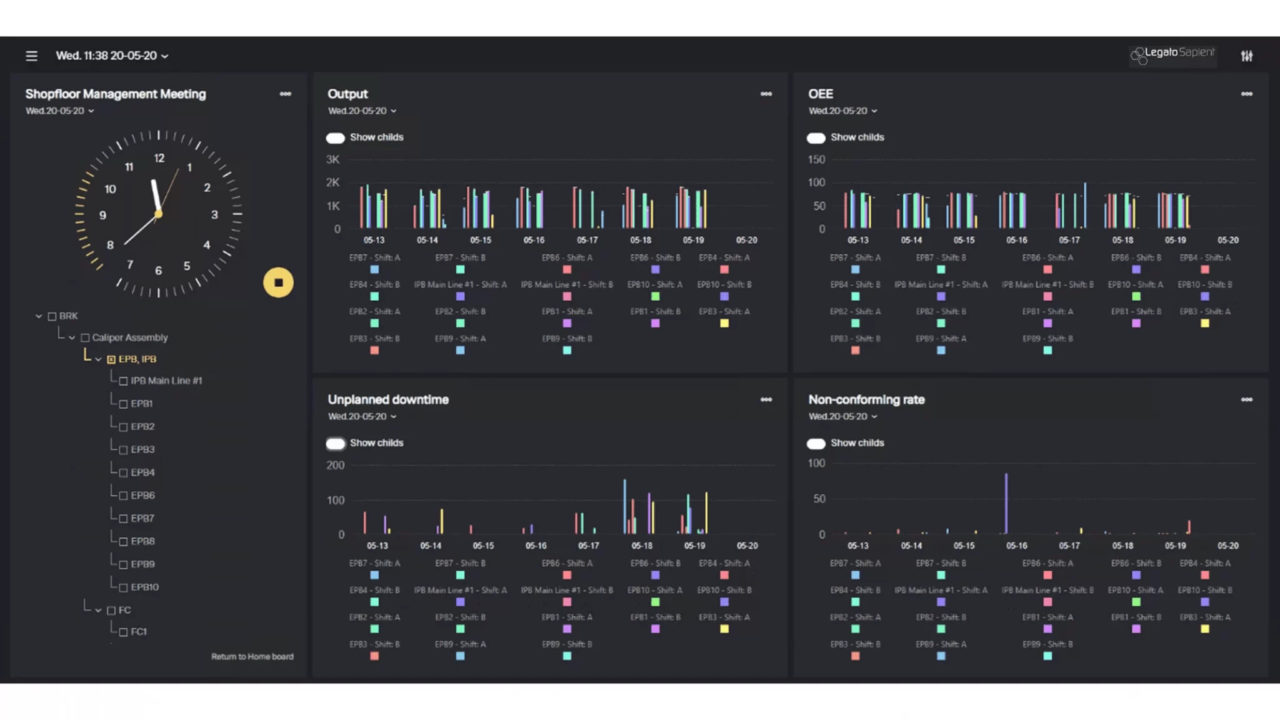
Digital Shopfloor Management: Example with a focus on online machine, process, quality and logistics data
The digital dashboard provides direct access to the necessary data of all types and origins. You have several options for importing data:
- Already available in the store floor system through machine data acquisition
- Manual input in the Interval Count Boardlet
- Connection via dedicated interface to another system (e.g. SAP, legacy MES)
- File-based import via data that is regularly updated and read in
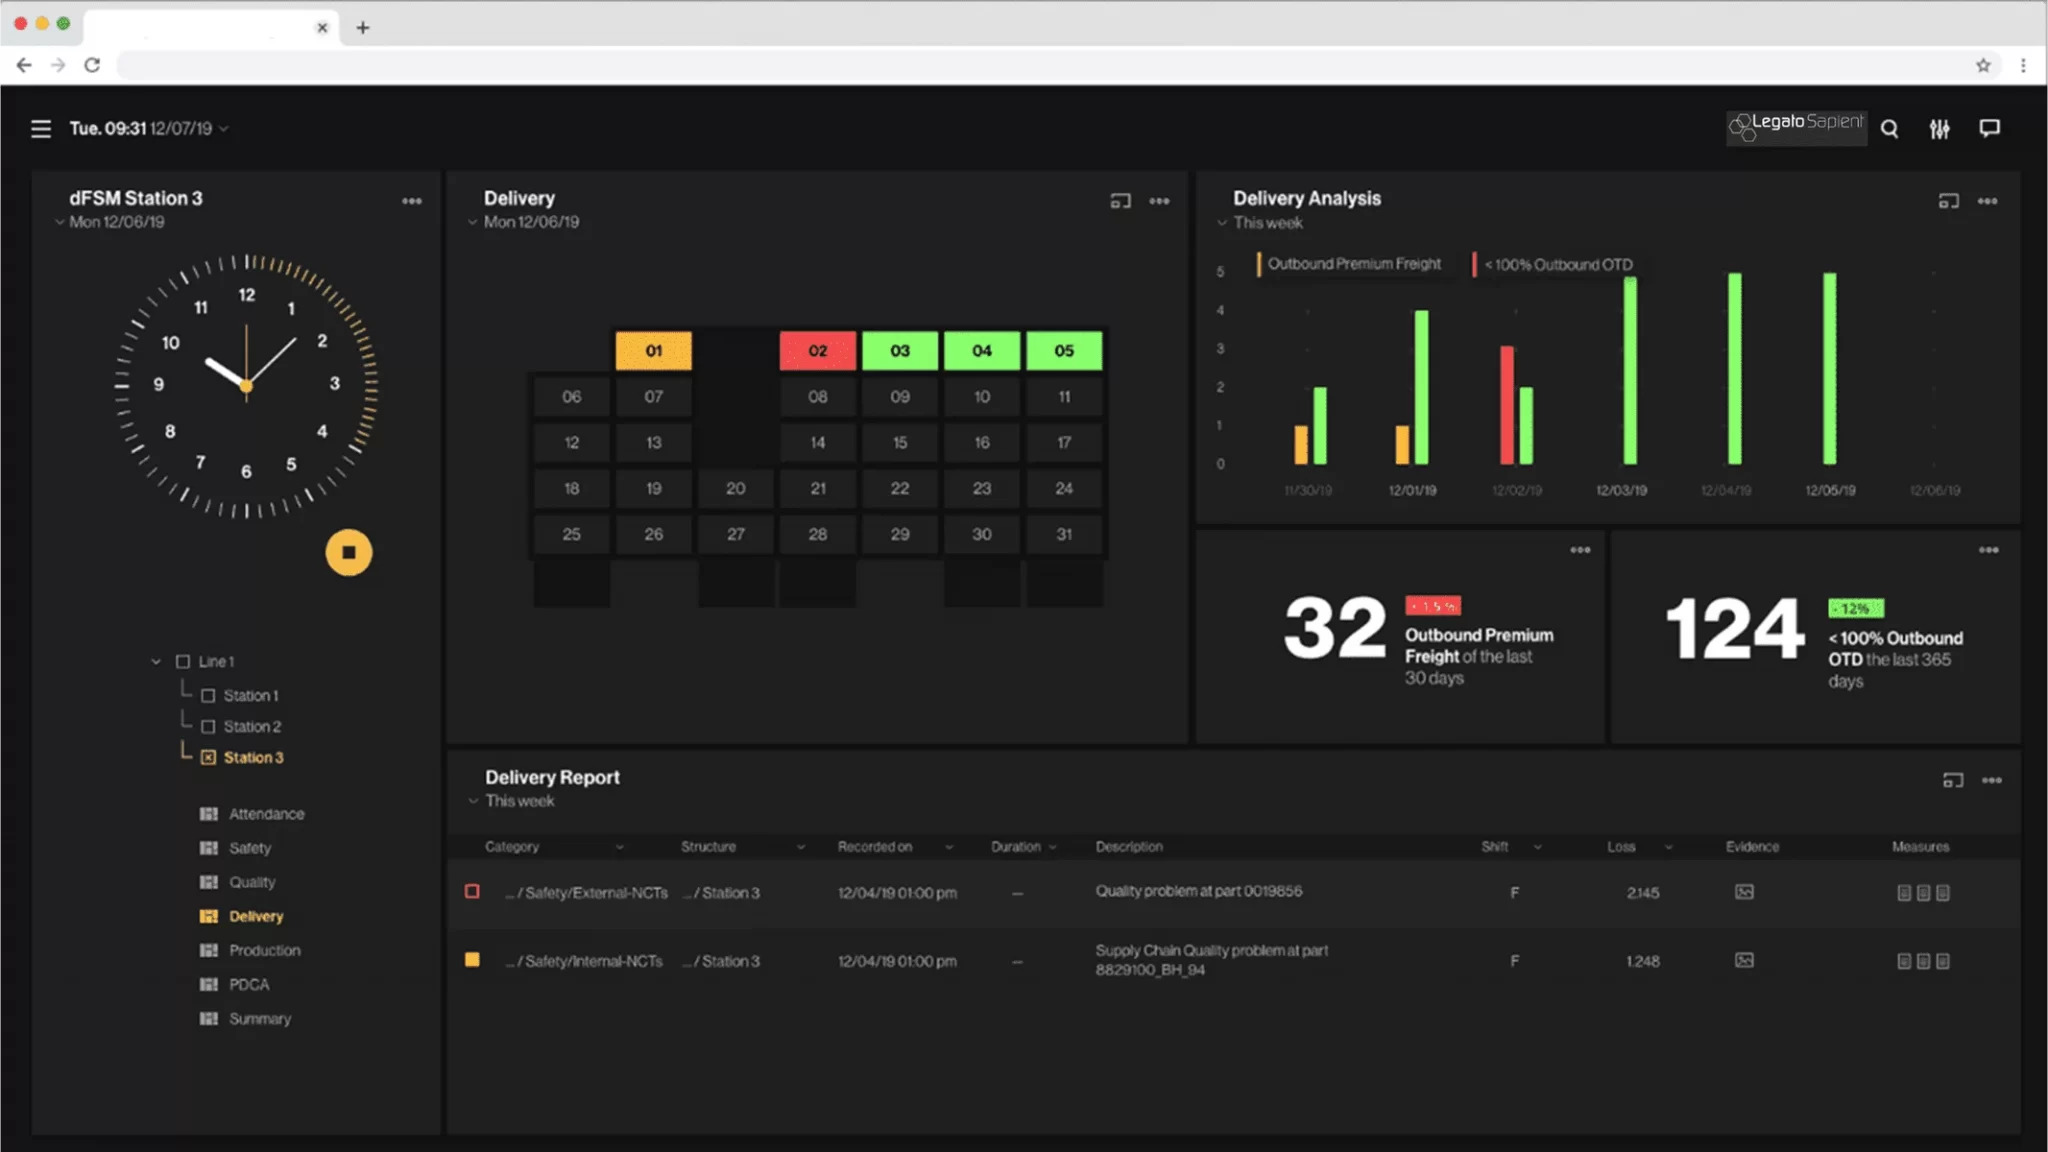
When discussing logistics, for example, the delays, expensive premium shipments, etc. are made available in a report. Furthermore, individual logistics problems (disruption in the high-bay warehouse, replenishment too late, …) are explained. All with drill-down functionality for more detailed information.
FAQ: Important questions about Digital Shopfloor Management
What is Shopfloor Management?
In manufacturing, “shop floor” means something like “hall floor”, “workshop” or “factory floor”. It is the place where production takes place and added value is created. Shopfloor Management therefore means that management takes place directly on the shopfloor, i.e. the production and value creation processes are controlled by the active presence of managers on site.
What is a shopfloor meeting?
The store floor meeting is an effective production management tool. It usually has a regular agenda, takes place daily and lasts around 15 minutes. Shopfloor meetings are a dialog between production managers and employees and help to openly address process problems, get to the root of them and eliminate them quickly.
Get in touch!
Would you like to know more about our solutions? Then please write us using the contact form. My colleagues and I look forward to exchanging ideas with you.

Dominik Weggler
Head of Sales Germanedge
